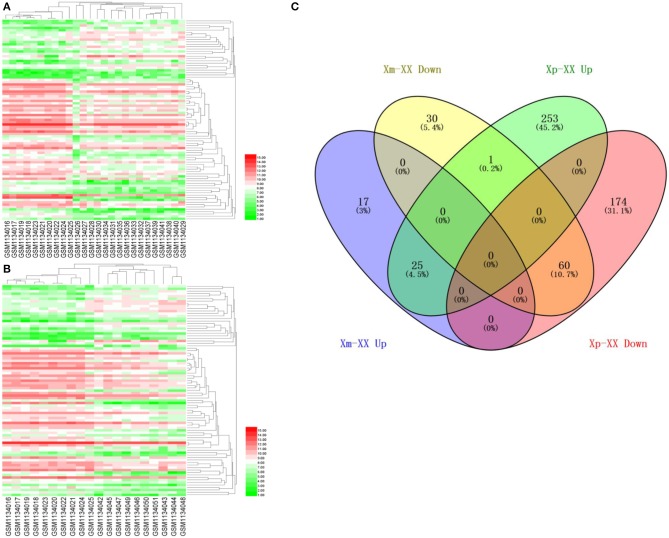
Figure 1.
A heatmap of 85 differentially expressed genes between monosomy X TS patients and 46,XX normal individuals. (A) Xm TS patients and normal individuals. (B) Xp TS patients and normal individuals. Red represents upregulated genes, and green represents downregulated genes. (C) Venn diagram of differentially expressed genes between monosomy X TS patients and 46,XX normal individuals. Up represents upregulated genes, and down represents downregulated genes.

