Figure 2.

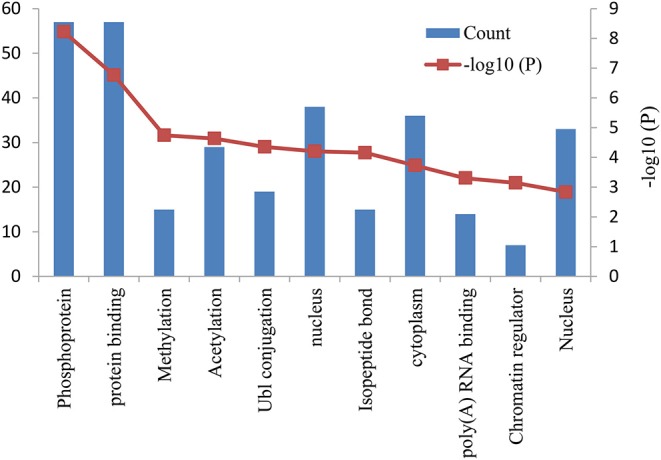
Bar graph of 11 representative enriched functional terms. The left-hand y-axis depicts the number of genes, and the right-hand y-axis depicts the –log10 (P-value). The x-axis lists the enriched functional terms.

Bar graph of 11 representative enriched functional terms. The left-hand y-axis depicts the number of genes, and the right-hand y-axis depicts the –log10 (P-value). The x-axis lists the enriched functional terms.