. 2019 Sep 27;8(6):928–938. doi: 10.1039/c9tx00191c

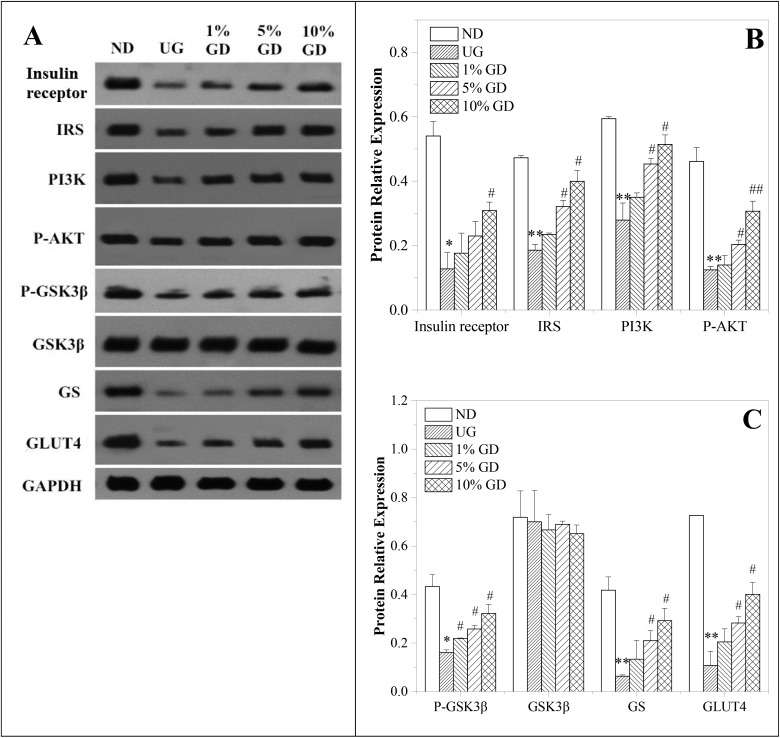
Fig. 4. Effects of the GD diet on the key proteins of the liver insulin signalling pathway of mice. (A) Western blot analysis of insulin receptor, IRS, PI3K, p-AKT, p-GSK3β, GSK3β, GS and GLUT4 protein expressions. (B) Quantitative analysis of insulin receptor, IRS, PI3K and p-AKT protein expressions. (C) Quantitative analysis of p-GSK3β, GSK3β, GS and GLUT4 protein expressions. ND, non-diabetic group; UG, untreated diabetic group; 1% GD, 1% GD-treated diabetic group; 5% GD, 5% GD-treated diabetic group; 10% GD, 10% GD-treated diabetic group. Data are expressed as means ± SD. *P < 0.05 and **P < 0.01, respectively, versus ND; #P < 0.05 and ##P < 0.01, respectively, versus UG.

Fig. 4