. 2020 Jan 10;11(6):1649–1656. doi: 10.1039/c9sc06337d

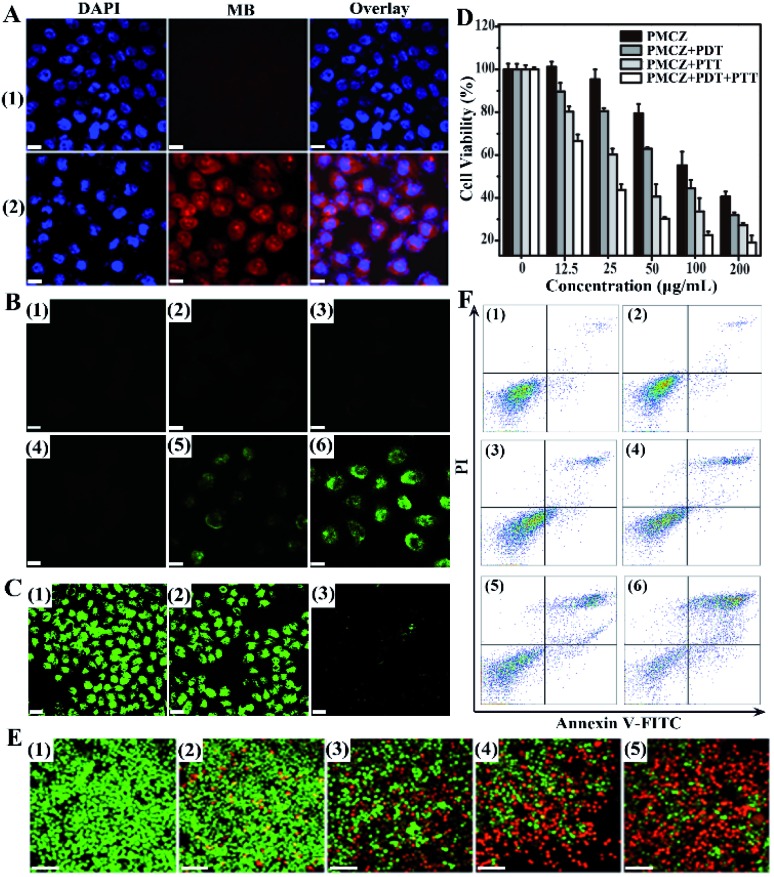
Fig. 3. In vitro anti-tumor efficacy of PMCZ nanomedicine. (A) Intracellular imaging of PMCZ (50 μg mL–1)-treated HeLa cells for 4 h. (B) CLSM images of intracellular ROS generation from intact HeLa cells (1), cancer cells with 660 nm photoirradiation (100 mW cm–2) (2), PMZ (50 μg mL–1) (3), PMCZ (50 μg mL–1) (4), PMZ (50 μg mL–1) with PDT (100 mW cm–2) (5), and PMCZ (50 μg mL–1) with PDT (100 mW cm–2) (6). (C) CLSM images of intracellular O2 generation from HeLa cells after 4 h of RDPP incubation with different treatments: Intact HeLa cells (1), PMZ (50 μg mL–1)-treated cancer cells (2), and PMCZ (50 μg mL–1) treated cells (3). (D) Viability of HeLa cells after their incubation with varied concentrations of PMCZ and photoirradiation (660 nm, 100 mW cm–2 or 808 nm, and 2 W cm–2). (E) Intracellular imaging of calcein AM/PI co-stained HeLa cells with different treatments: intact HeLa cells (1), PMCZ (50 μg mL–1)-treated cells (2), PMCZ (50 μg mL–1) + PDT (660 nm, 100 mW cm–2) (3), PMCZ (50 μg mL–1) + PTT (808 nm, 2 W cm–2) (4) and PMCZ (50 μg mL–1) + PDT (660 nm, 100 mW cm–2) + PTT (808 nm, 2 W cm–2) (5). Scale bar, 50 μm. (F) Flow cytometric analysis of differently treated HeLa cells after Annexin V and FITC-PI staining, intact HeLa cells (1), PMCZ (50 μg mL–1)-treated cells (2), PMCZ (50 μg mL–1) + PDT (660 nm, 100 mW cm–2) (3), PMCZ (50 μg mL–1) + PTT (808 nm, 2 W cm–2) (4), PMZ (50 μg mL–1) + PDT (660 nm, 100 mW cm–2) + PTT (808 nm, 2 W cm–2) (5) and PMCZ (50 μg mL–1) + PDT (660 nm, 100 mW cm–2) + PTT (808 nm, 2 W cm–2) (6). Scale bar, 50 μm.

Fig. 3