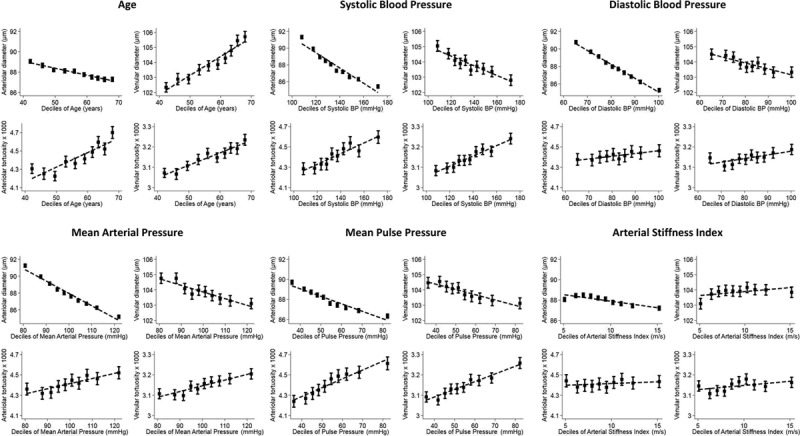
Figure 2.

Adjusted mean retinal vessel width and tortuosity by deciles of cardiovascular disease (CVD) risk factors. Adjusted means (solid square symbols), 95% CIs (solid vertical error bars) and regression line (dotted line) are from a multilevel model allowing for age, sex, and CVD risk maker decile as fixed effects and repeated retinal vessel measures within each person. BP indicates blood pressure.
