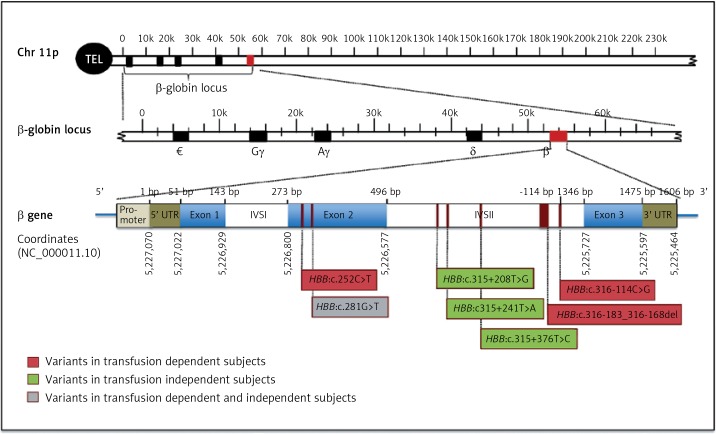
Figure 1.
Schematic representation of HBB gene structure and novel identified variant locations. The position of the mutations is indicated below the gene. Novel mutations detected in subjects with transfusion-dependent are in red, mutations detected in normal subjects are in green, and the mutation identified in both subjects is in gray

