Figure 3.
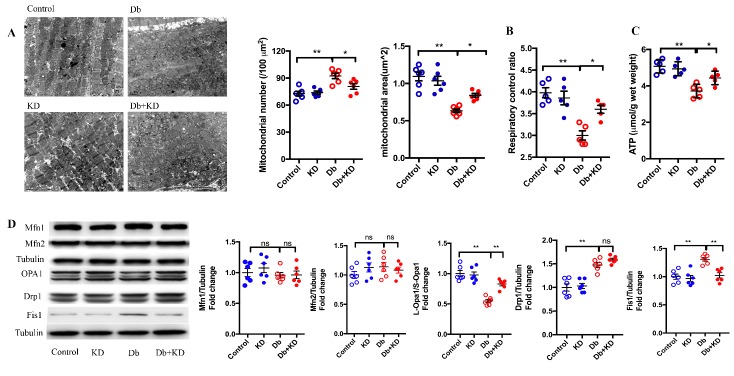
The ketogenic diet prevented mitochondrial fission and improved mitochondrial function in the myocardium of db/db mice. A) Cardiac mitochondrial morphology in myocardial samples. Typical images obtained from electron microscopy are shown in the left panel. Scale bar, 1 μm. Average mitochondrial size and mitochondrial number are shown in the right panel; n=6 mice from each group. B) Mitochondrial respiratory control ration; n=5 mice from each group. C) ATP levels in the heart of the mice; n=5 mice from each group. D) The content of mitochondrial dynamics-related proteins in myocardial samples. Statistical results are shown in the right panel; n=6 mice from each group. Values are the mean ± SEM. Data are analyzed using two-way ANOVA, followed by unpaired t-tests. *, P<0.05. **, P<0.01. ns indicates no significance.

