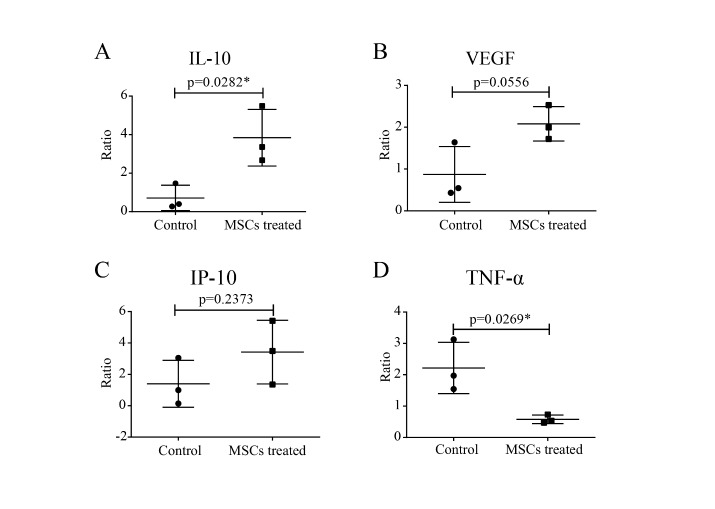
Figure 4.
The profile of serum cytokine/chemokine/growth factors. The ratio of serum cytokines IL-10 (A), growth factor VEGF (B), the chemokine IP-10 (C) and TNF-α (D) before and after MSCs treatment were detected in severe patients compared with the control group without MSCs by panel assay analysis, respectively. Ctrl: placebo control group. P-values were determined using Student’s t-test. *P < 0.05.

