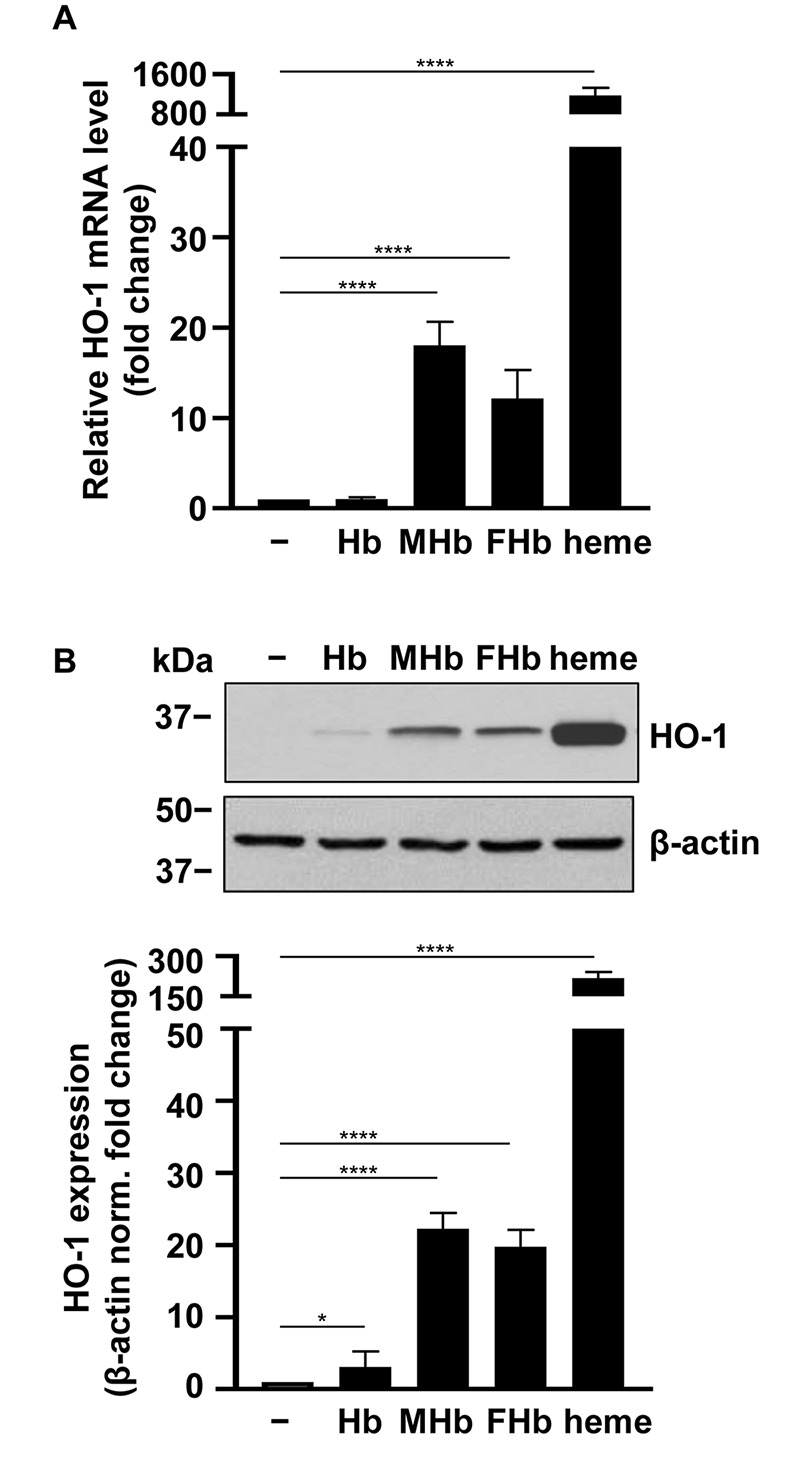
FIGURE 4.

Induction of HO-1 mRNA and protein expression by different Hb forms in HBECs. Confluent HBECs (P5-8) were exposed to vehicle, Hb, MetHb (MHb), ferrylHb (FHb), and heme (25 μmol/L heme group) in 1% FBS. (A) Relative mRNA expression (4 h, mean ± SD) of HO-1 normalized to GAPDH from three independent experiments performed in triplicates. (B) HO-1 protein levels (16 h) were analyzed by western blot from whole cell lysates. Membranes were re-probed for β-actin. Representative blots of three independent experiments are shown. Densitometry analysis (mean ± SD) of three independent experiments. (A,B) P-values were calculated using one-way ANOVA followed by Dunnett’s post hoc analysis. *p < 0.05 and ****p < 0.001.
