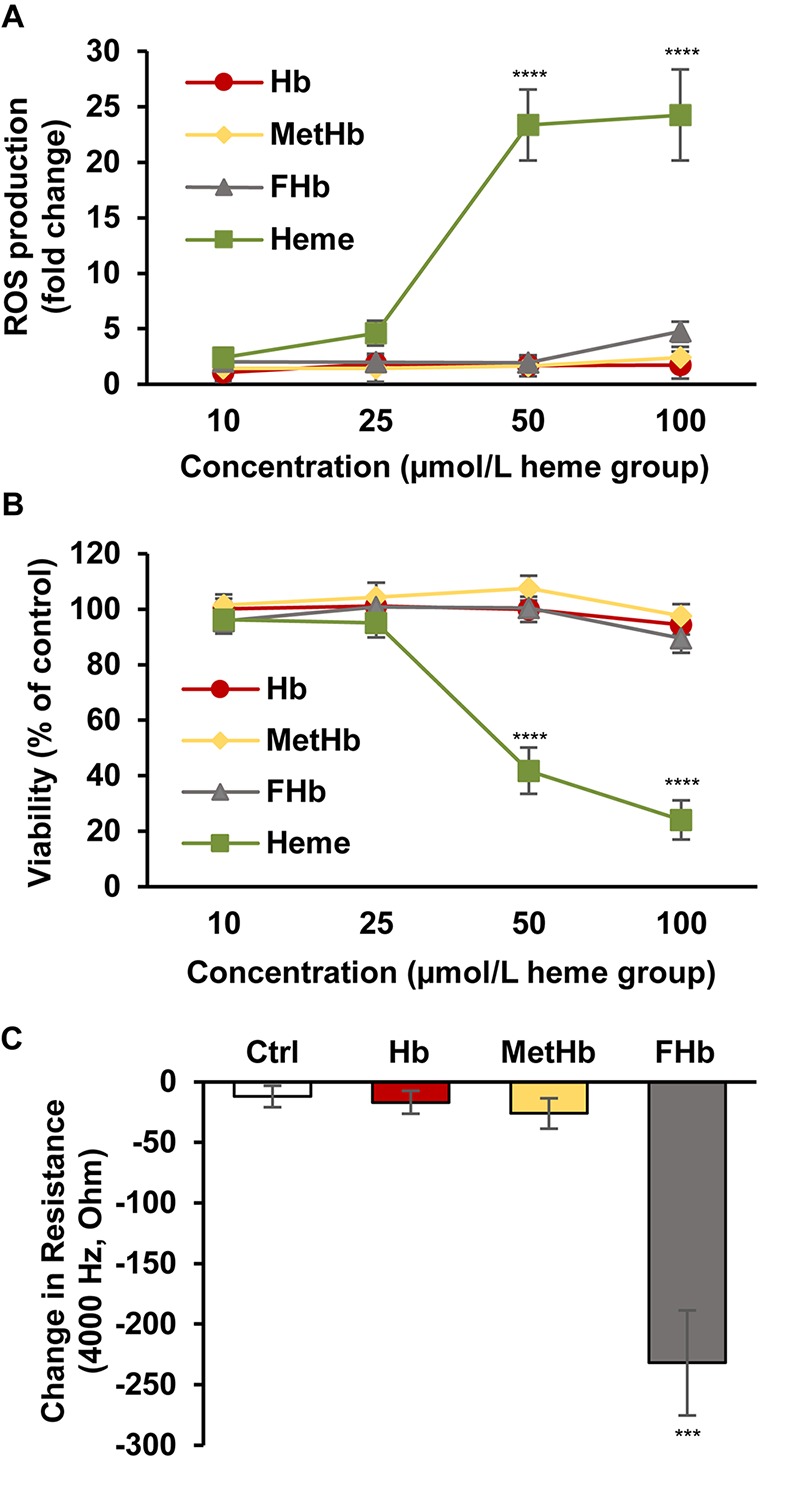
FIGURE 5.

Induction of ROS production and cell death by different Hb forms in HBECs. (A) Confluent HBECs (P5-8) were exposed to vehicle, Hb, MetHb, ferrylHb (FHb), and heme (10, 25, 50, 100 μmol/L heme group) in 1% FBS for 4 h, then ROS production was monitored by DCFDA assay for an additional 4 h. Graph shows ROS production (mean ± SD) at 4-h time point from three independent experiments performed in quadruplicates. (B) Confluent HBECs (P5-8) were exposed to vehicle, Hb, MetHb, ferrylHb (FHb), and heme (10, 25, 50, 100 μmol/L heme group) in 1% FBS and cellular viability (24 h) was assessed by MTT assay. Graph shows cell viability as a percentage of viability of vehicle-treated cells (mean ± SD) from three independent experiments performed in quadruplicates. (C) HBECs cultured in 8-well ECIS plates were exposed to Hb, metHb, and ferrylHb (FHb) (50 μmol/L heme group) in 1% FBS containing media. The complex impedance spectrum was monitored with an ECIS Zθ instrument for 4 h. Change in resistance (mean ± SD) was calculated based on the difference between monolayer resistance at 4,000 Hz at 0 time point and 4 h from three independent experiments performed in triplicates. (A–C) P-values were calculated using one-way ANOVA followed by Tukey’s multiple comparison analysis. ***p < 0.005, ****p < 0.001.
