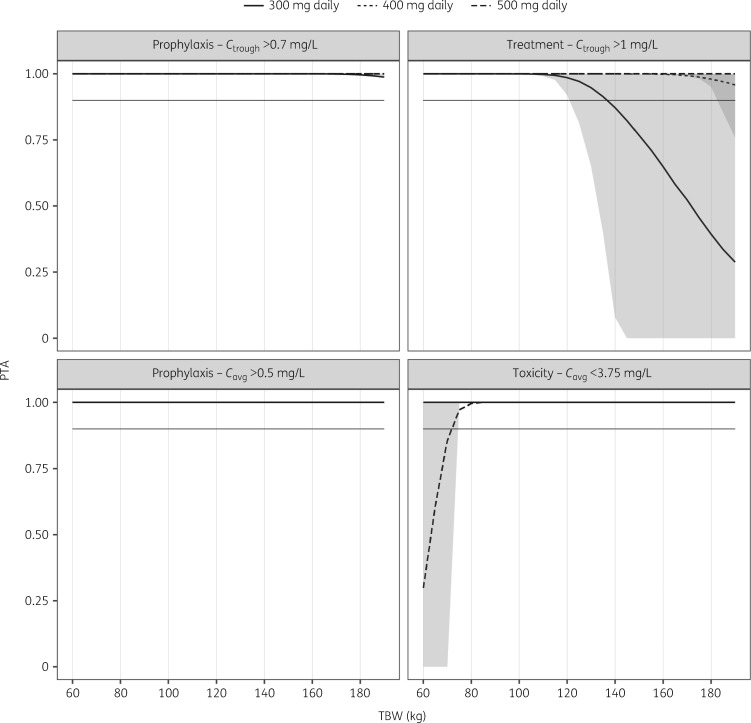
Figure 4.
PTA versus TBW in steady-state for targets for prophylaxis, treatment and toxicity for three dosage regimens. The grey horizontal line represents a target attainment of 90%. The light grey shading around the lines represents the 95% CI of the prediction. The dark grey shading represents the overlap between the CIs of the 300 and 400 mg daily doses. For the toxicity PTA the value 1 represents the probability of staying below the 3.75 mg/L Cavg.

