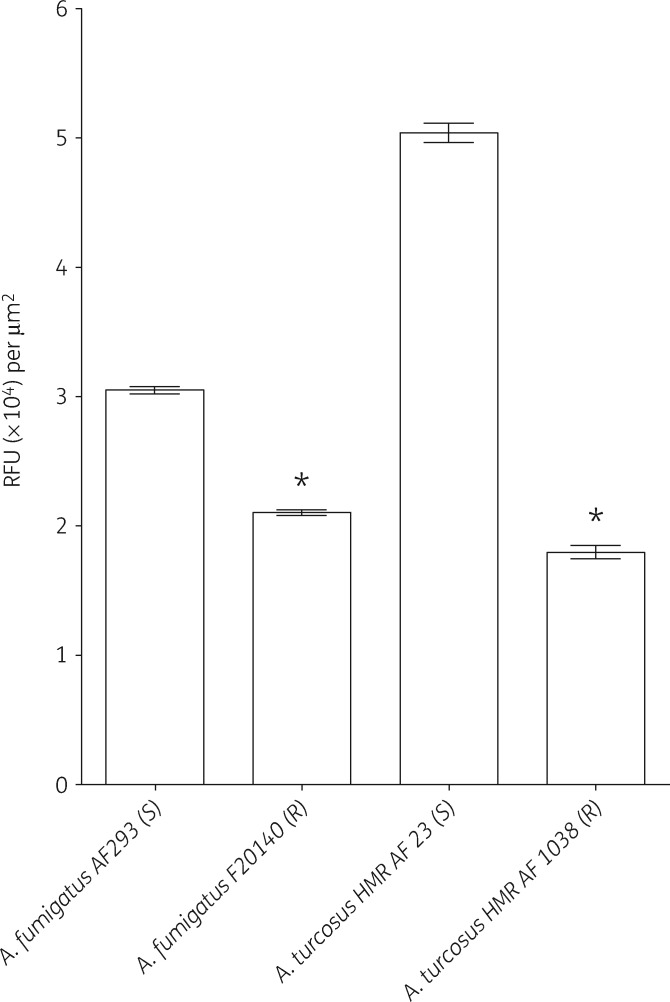
Figure 5.
Accumulation of Nile red in azole-susceptible (S) and -resistant (R) Aspergillus isolates. Data represent mean ± SEM of a single experiment. A second experiment produced comparable results (data not shown). An asterisk indicates P < 0.001 compared with the susceptible strain of the same species, Student’s t-test. RFU, relative fluorescence units.

