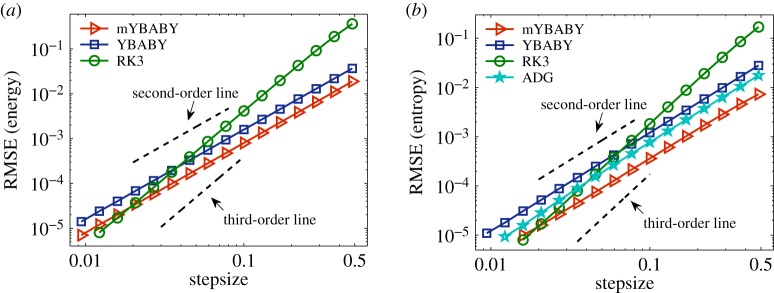
Figure 6.
Double logarithmic plot of the root-mean-square error (RMSE) (4.1) in the total energy (3.1) (a) and entropy (b) against stepsize by comparing the two split GENERIC integrators introduced in this article with the third-order Runge–Kutta (RK3) method and the average discrete gradient (ADG) method with a damping rate of γ = 0.01 and a total simulation time of Ts = 180 in a standard setting of a damped nonlinear oscillator as described in §4a. In this case, the position of the damped nonlinear oscillator also oscillates with an associated period of Tp ≈ 8.4. The format of the plots is the same as in figure 2. (Online version in colour.)

