
Figure 1.
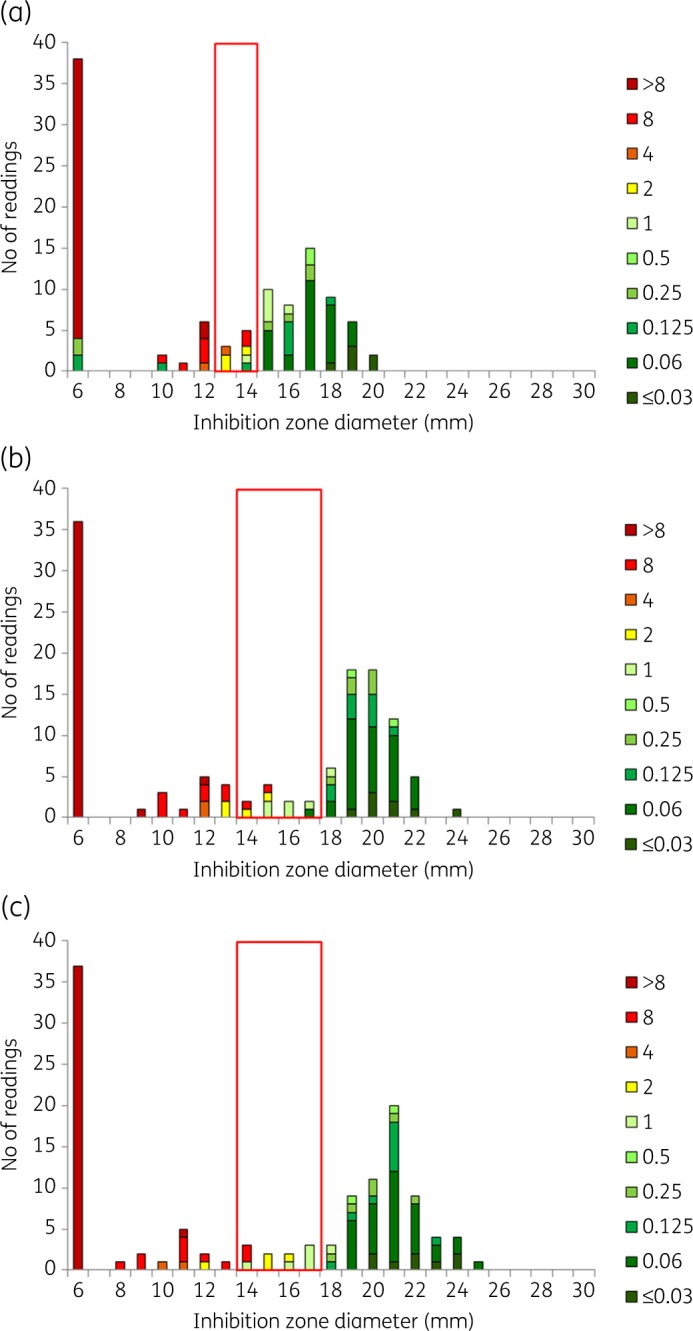
Cefotaxime BMD MIC and inhibition zone diameter distributions for RAST after (a) 4 h, (b) 6 h and (c) 8 h incubation for E. coli (n = 60) and cefotaxime 5 μg. All isolates were tested on MH agar from two manufacturers in parallel, resulting in a theoretical maximum number of 120 results. The colour coding shows MIC values (mg/L) of isolates. The red box shows the ATU where interpretation is not permitted. Zone diameters greater than the ATU are interpreted as S and zones smaller than the ATU are interpreted as R. Data for all other agent/organism combinations are available as Supplementary data (Figures S1 to S7).