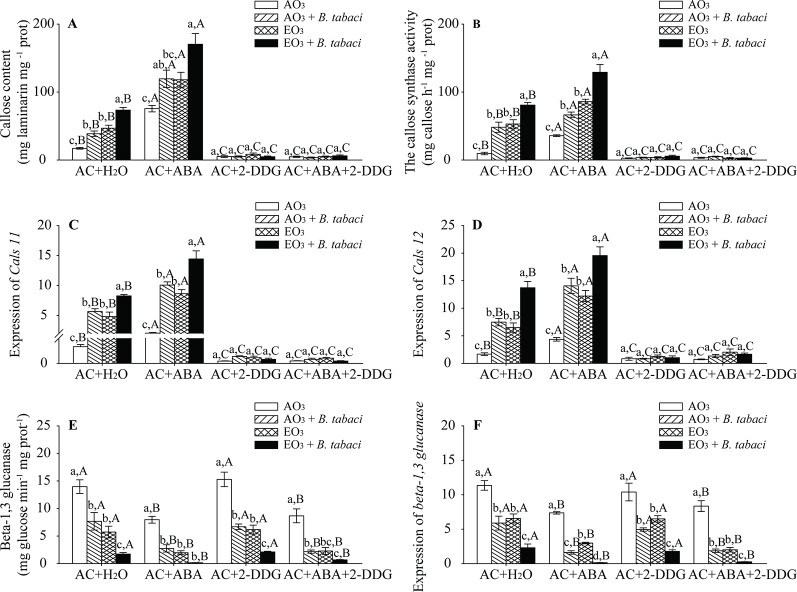
Figure 6.
Callose content, enzyme activity, and fold-change in the expression of related genes involved in the callose synthesis and degradation for wild-type AC plants treated with H2O, ABA, 2-DGG, and ABA plus 2-DDG, grown under ambient O3 (AO3) and elevated O3 (EO3) with and without B. tabaci infestation. (A) Callose content, (B) callose synthase activity, (C) relative expression of Cals 11 gene, (D) relative expression of Cals 12 gene, (E) beta-1,3 glucanase activity, and (F) relative expression of beta-1,3 glucanase gene. Each value represents the average (± SE) of four OTCs (eight plants for each treatment per OTC). Different lowercase letters indicate significant differences among the combinations of B. tabaci infestation and O3 concentrations within the same chemical reagent treatment. Different uppercase letters indicate significant differences among different chemical reagent treatments within the same O3 concentrations and B. tabaci infestation, as determined by Tukey's multiple range test at P < 0.05.

