. 2020 Feb 12;11(10):2843–2854. doi: 10.1039/c9sc04722k

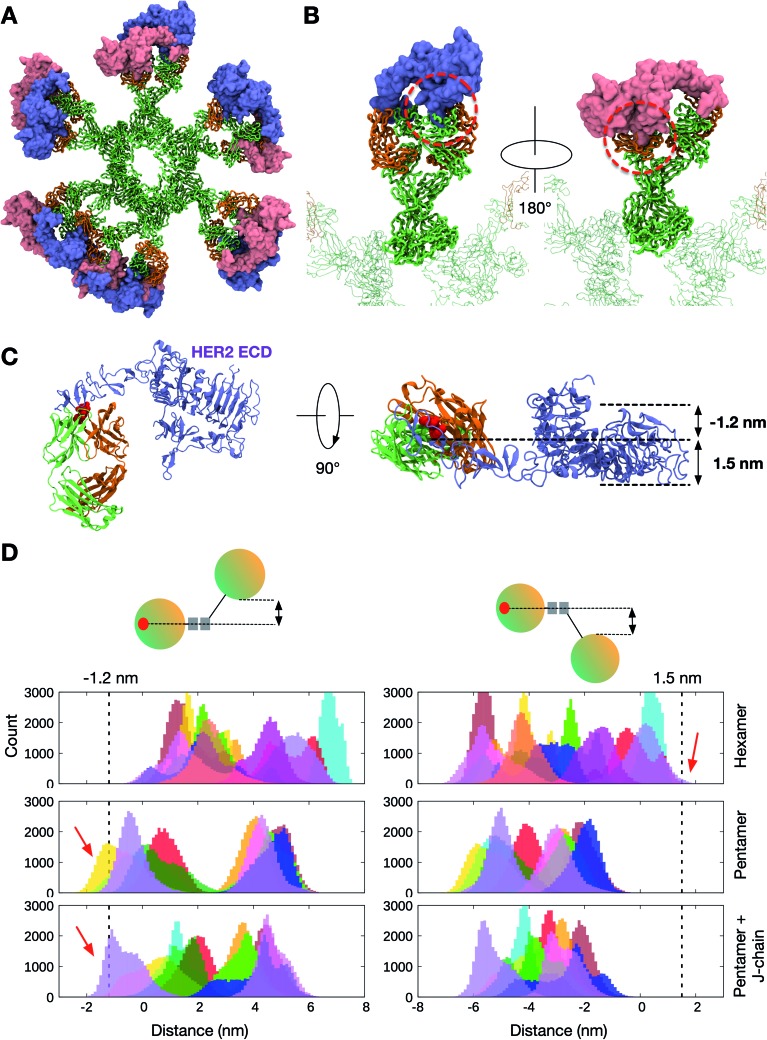
Fig. 5. The binding of HER2 ECDs to the Trastuzumab IgM hexamer. (A) Twelve HER2 ECDs (pink and purple) aligned onto the initial model of the Trastuzumab IgM hexamer based on the previously elucidated monomeric binding site.27 (B) Enlarged images of one IgM subunit with HER2 bound. Dotted red line highlights the steric clashes between the globular domain of HER2 and the adjacent Fab domain of IgM. Only one HER2 ECD is shown in each image for clarity. IgM is shown in ribbon representation and coloured green and orange for heavy and light chains, respectively, and HER2 ECDs are shown in surface representation. (C) Side (left) and top (right) views of the crystal structure of the Trastuzumab Fab–HER2 ECD complex. Light and heavy chains are orange and green, respectively, while the binding site residues are highlighted in red. The space required to accommodate HER2 ECDs is shown on the right. (D) Distance distribution between the center of mass of the binding site residues on a Fab domain and the bottom-most (left) or the top-most (right) point on the adjacent Fab domain. Different colors depict the ten/twelve different Fab domains in each IgM. The data were extracted from three independent apo simulations of the Trastuzumab IgM hexamer, pentamer, and pentamer with a J-chain. Dotted lines indicate the distance cut-off required for HER2 binding and red arrows show the parts of the distance distributions that meet this requirement.

Fig. 5