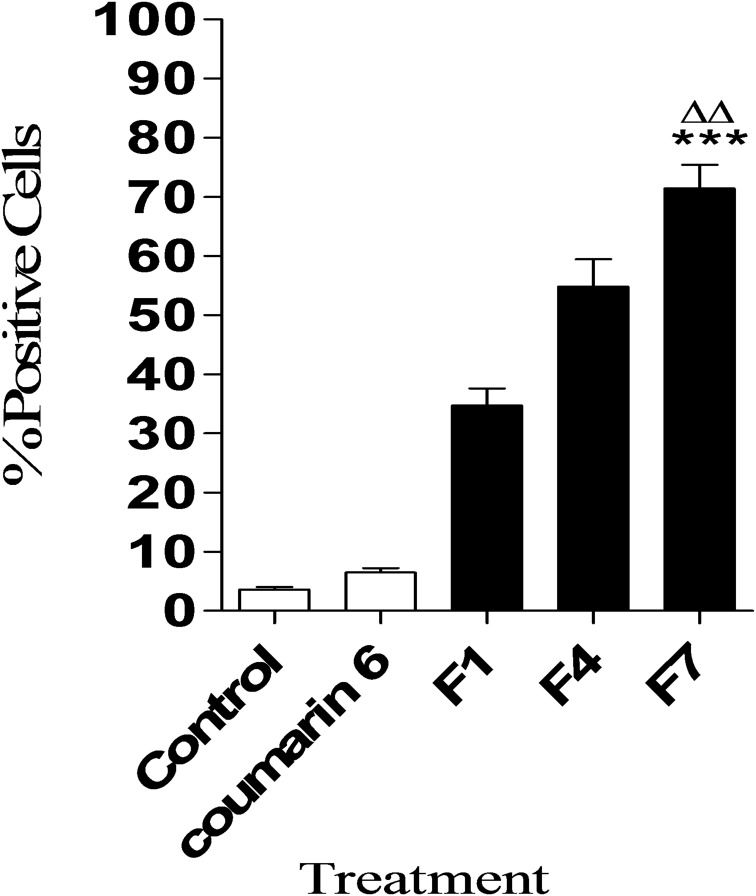
Figure 4.
Quantitative cellular uptake of different types of HK NCs (F1, F4, and F7) determined by flow cytometry after 24 hrs of treatment. Results are represented as the percentage of positive cells showing cellular uptake of each NC. Values are mean ± SD for (n = 3). ***p < 0.001 compared with control, coumarin 6 and F1 groups. ΔΔp < 0.001 compared with F4.

