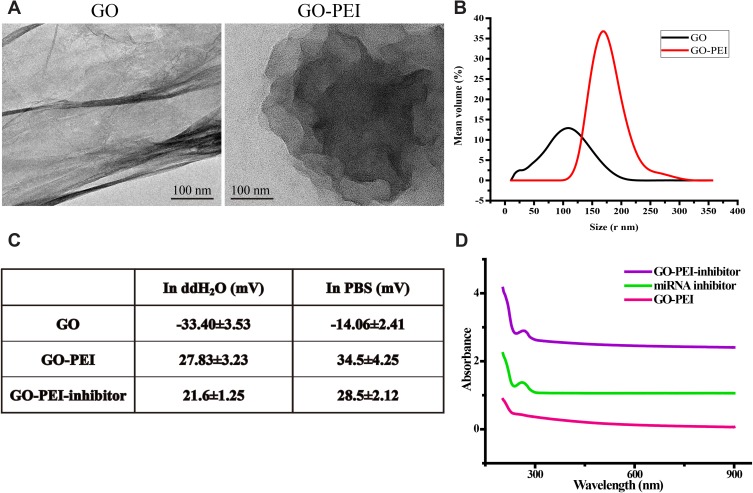
Figure 2.
Characterization of GO-PEI complexes. (A) SEM images of GO and GO-PEI complexes. Scale bars: 100 nm. (B) Measurement of the size distribution of GO and GO-PEI by DLS. (C) Measurement of the zeta potential of GO and the GO-PEI complexes in water and PBS solution. (D) UV-vis spectra normalized by their extinction coefficients at 260 nm. The purple line is for the GO-PEI-miR-214 inhibitor complex, the green line is for free miR-214 inhibitor sense strand, and the red line for GO-PEI.

