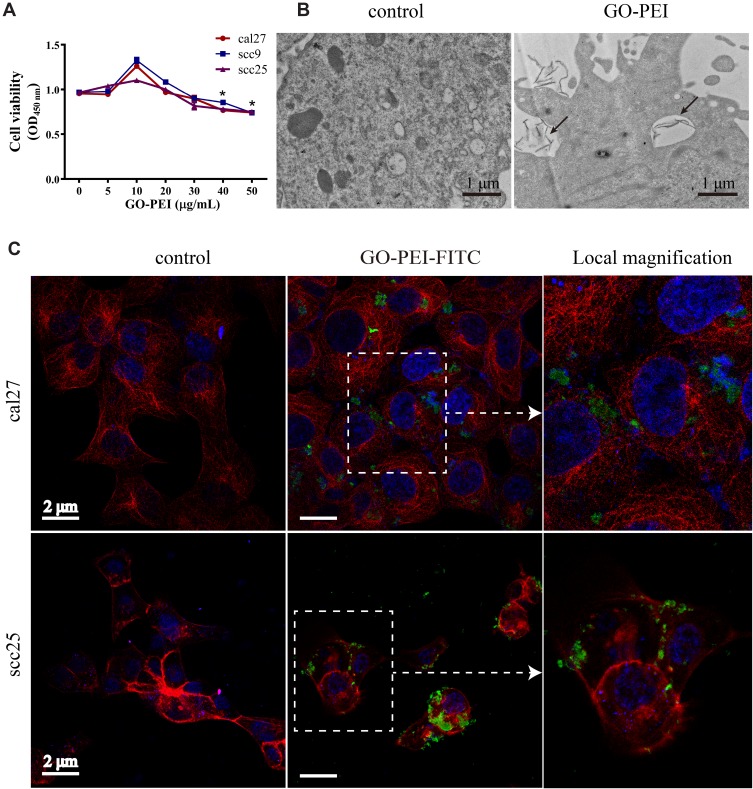
Figure 3.
Cell uptake of GO-PEI. (A) Relative cell viabilities of Cal27, SCC9 and scc25 cells treated with different concentrations of GO-PEI for 24 h. (B) TEM images of nontreated cells (named control) and GO-PEI-treated cells (5 μg/mL). Scale bars: 1 μm. (C) Fluorescent images of FITC-labeled GO-PEI (green) within Cal27 and scc25 cells are shown. The cell cytoskeleton was stained with α-tubulin (red), and the nuclei were stained with DAPI (blue). The right panel shows enlarged images of white squares in the image of cells incubated with GO-PEI. Scale bars: 2 μm.

