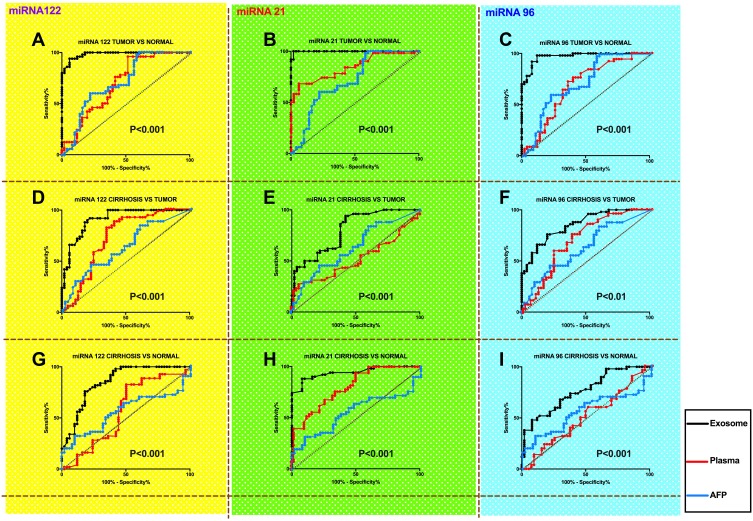
Figure 3.
Comparing diagnostic significance for patients with HCC among miRNAs in exosome, plasma and AFP levels between different groups (A, D, G: comparsion of miR-122; B, E, H: comparsion of miR-21; C, F, I: comparsion of miR-96). The black lines represent exosomal levels and the red lines represent plasma levels.

