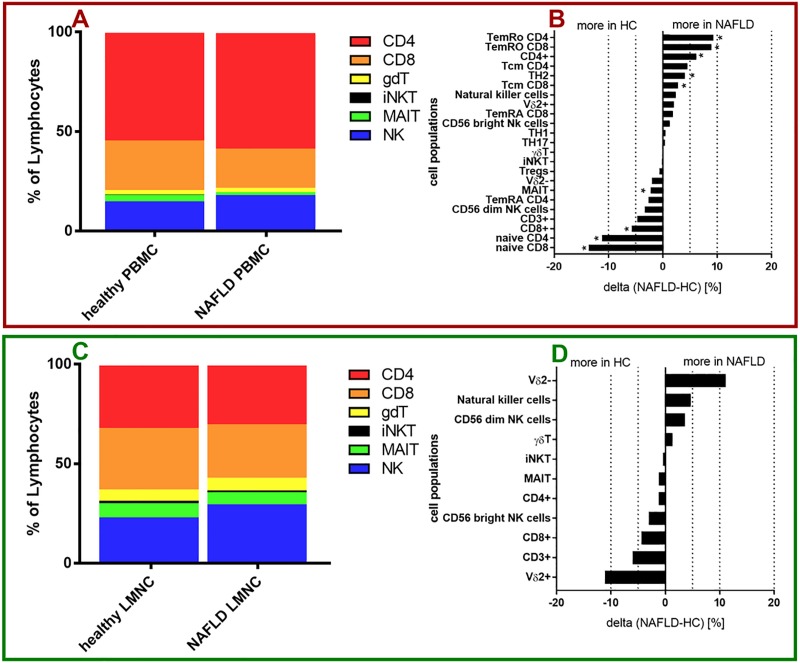
Fig 1. Immune cell composition in NAFLD.
(A, C) Composition of infiltrating immune cells in PBMC (A) and liver samples (C) of healthy controls as well as NAFLD patients summarized from calculated mean values of each patient group. (B, D) Changes of immune cell composition between NAFLD patients and healthy controls in PBMC samples (B) and liver samples (D). (red Box) PBMC data. (green Box) liver data. (B,D) For comparisons Mann-Whitney test was used. *p<0.05.

