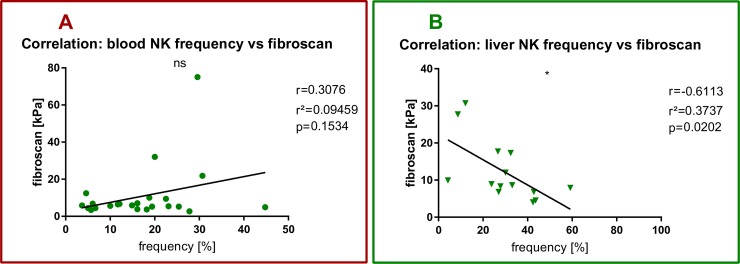
Fig 3. NK cells and hepatic fibrosis in NAFLD.
Each spot represents one patient. (A) PBMC data. (B) intrahepatic data. (A) Pearson’s correlation between peripheral NK cell frequency and fibroscan with Pearsons r, r2 and p value. (B) Pearson’s correlation between intrahepatic NK cell frequency and fibroscan with Pearsons r, r2 and p value. *p<0.05, **p>0.01.

