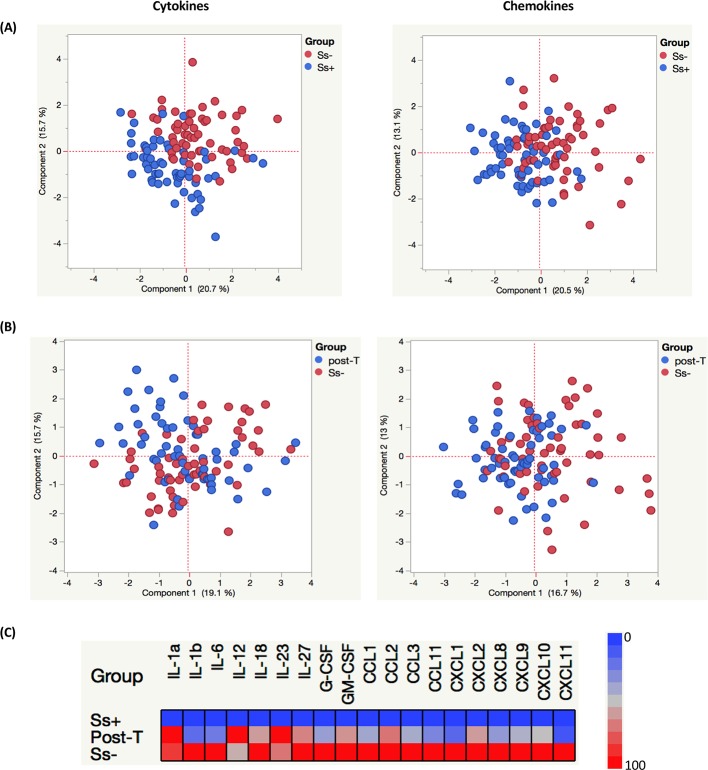
Fig 5. Principal component Analysis (PCA) and heatmaps depicting circulating levels of cytokines and chemokines in Ss+ (pre- and post-treatment) and Ss- individuals.
(A and B) Principal component analysis (PCA) was performed to show the distribution of data from the combination of two groups Ss+ (blue circles) and Ss- (red circles)(A); and Post-T Ss+ (blue circles) and Ss- (red circles) (B). The PCA represents the two principal components of variation. (C) Heatmaps depicting the circulating levels of cytokines and chemokines in Ss+ (pre- and post-treatment) and Ss- individuals. Data (and scale) are log10 geometric mean fold change for each of the analytes measured for each of the groups. Plasma levels for Ss+, post treated and Ss- individuals were shown respectively, in which each row stands for a sample and each column stands for a cytokine and chemokines. Red color represents the highest values whereas blue color indicates the lowest values measured for each analyte.

