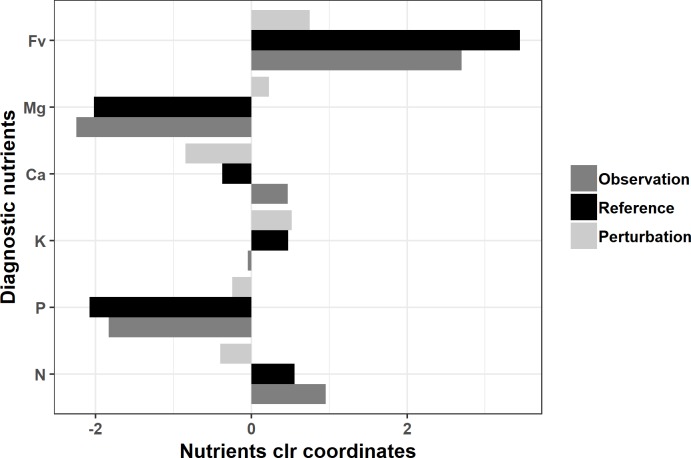
Fig 3. Perturbation vector example mapped using the most imbalanced sample.
The most imbalanced observation nutrient composition was (0.0601, 0.0037, 0.0355, 0.0032, 0.0048. 0.8919), the nearest reference composition was (0.0561, 0.0036, 0.0603, 0.0052, 0.0184, 0.8565), the corresponding perturbation vector was (0.0919, 0.0965, 0.1696, 0.1629, 0.3832, 0.0959) for N, P, K, Mg, Ca and Fv respectively. The Aitchison distance computed between the observation and its associated true negative was 1.135.

