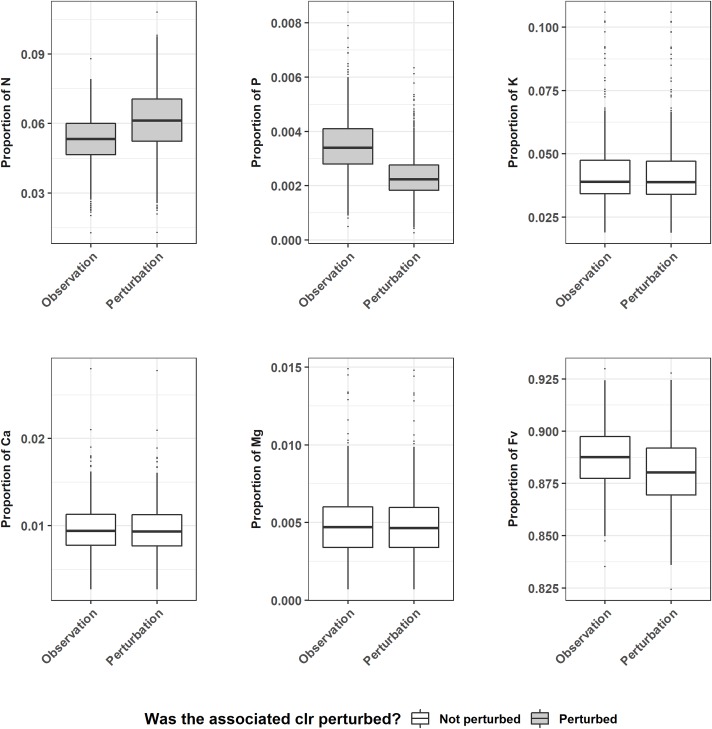
Fig 4. Effect of the perturbation of N and P clr coordinates on the other element proportions.
‘Observation’ stands for the element’s original proportion, ‘Perturbation’ designates the new proportion after the ‘Observed’ vector’s clr value was offset. Greyed boxplots plot distribution of perturbed elements of the simplex.

