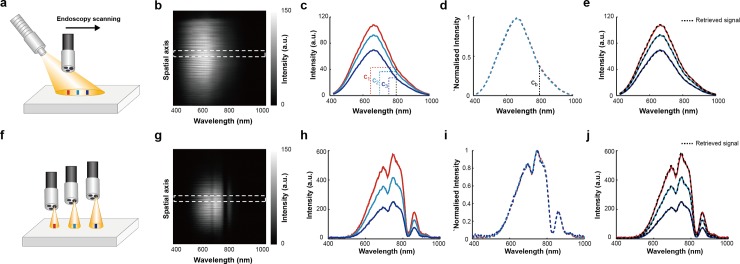
Fig 2. Spectral profiles of different illumination conditions can be accurately retrieved through hyperspectral endoscopy by different illumination methods.
(a) Schematic of the external illumination methods. Red, green, and blue lines indicate the hyperspectral imaging regions. (b) Representative spectral image from the hyperspectral endoscope during external illumination. (c) Average spectral signals of the three hyperspectral images measured at the different locations shown in (a) obtained from the white-dashed region in (b). (d) Min-max normalisation of spectral signals in (c) show complete overlap. (e) Spectra obtained (black dashed lines) using the normalised spectral profile in (d) and ratio of values at 800 nm (c1, c2, c3, and cb). (f-j) As above but for the internal illumination method.

