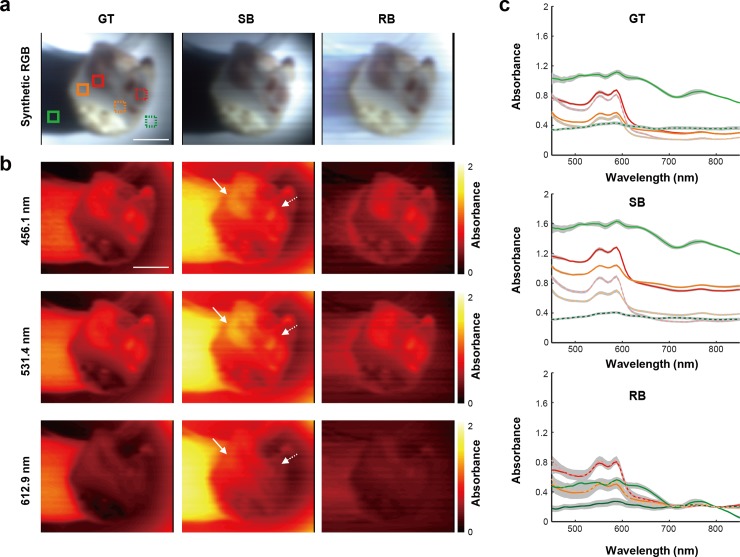
Fig 5.
HSI data from a chicken tissue sample obtained using the RB method agrees well with the GT (a) Synthetic RGB images of the sample were created from hypercubes obtained by exploiting ground truth, single, and retrieved backgrounds. (b) Representative slice images from each hypercube (GT, SB and RB) were illustrated at three wavelengths (456.1, 531.4 and 612.9 nm). Solid and dashed arrows indicate anatomically similar structures in the sample. (c) Average absorbance of the hypercube reconstructed by using the GT, SB and RB methods within solid and dashed squares shown in (a) were obtained. Gray shaded area indicates the standard deviation. Scale bars: 1 cm.

