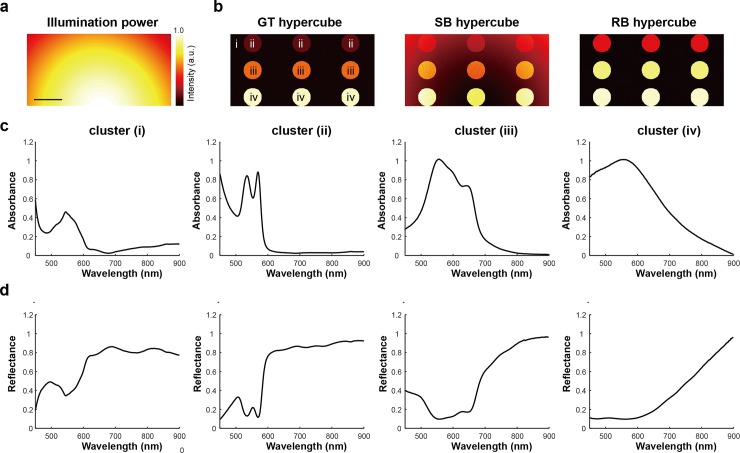
Fig 6. Synthetic absorbance and reflectance hypercubes created based on experimentally measured hyperspectral signals and randomly generated illumination conditions.
(a) Representative image of Gaussian illumination power. (b) Representative projection images of synthetic GT, SB, and RB hypercubes. (i)-(iv) indicate the areas with spectral profiles of corresponding signals shown in (c, d). Three circles in the same horizontal position had the same spectral profile and were defined as a cluster. (c, d) Four experimentally measured absorbance and reflectance spectra (muscle tissue, oxygenated blood, methylene blue, and nigrosin samples) were exploited to create synthetic absorbance and reflectance hypercubes. Scale bar: 100 pixels.

