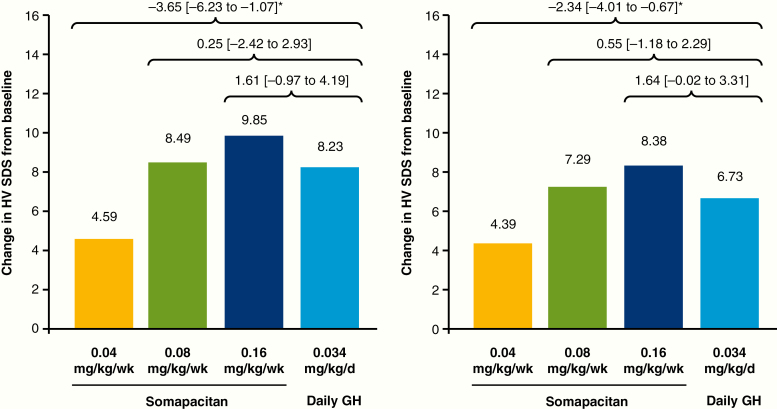
Figure 5.
Mean height velocity SDS: change from baseline to week 26 (left) and week 52 (right). Data are estimated mean values. Numbers above brackets are estimated treatment differences (weekly somapacitan–daily GH) and 95% CI. *Denotes statistical significance. d, day; GH indicates growth hormone; HV SDS, height velocity SD score; wk, week.

