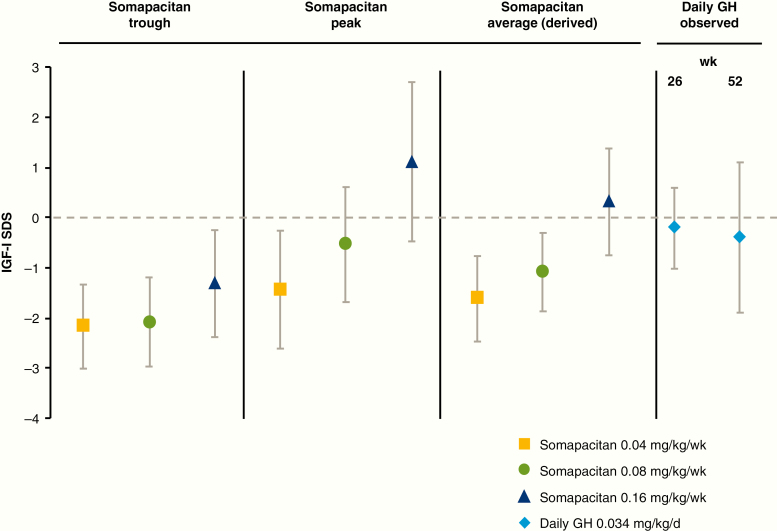
Figure 8.
Mean IGF-I SDS: observed and derived values. Somapacitan trough values are an average from values obtained 7 days after dose at weeks 4, 13, and 39. Somapacitan peak values are an average from values obtained 1 to 4 days after dose at weeks 26 and 52. Somapacitan average values were derived by population PK/PD modeling. Daily GH IGF-I levels from week 26 and 52 are shown for reference. Points and bars are means with SD. d, day; GH indicates growth hormone; PK/PD, pharmacokinetic/pharmacodynamic; SDS, SD score; wk, week.

