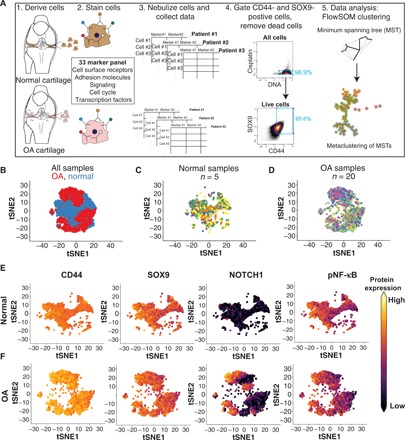
Fig. 1. High-dimensional profiling of normal and OA chondrocytes using mass cytometry.

(A) Schematic outlining the procedures used to profile chondrocytes by mass cytometry. Briefly, cells are dissociated from cartilage tissue, stained with metal-conjugated antibodies, and analyzed using cyTOF. The resulting data are then gated for live, SOX9/CD44-positive chondrocytes that are used for downstream analyses, including identifying clusters with FlowSOM. (B) tSNE projections of the normal (blue) and OA (red) chondrocytes where each cell is represented by a dot. Each group was downsampled randomly to 9000 cells. (C) Normal chondrocytes colored by patient sample, downsampled to 9000 cells. (D) OA chondrocytes colored by patient sample, downsampled to 9000 cells. (E) tSNE plots of 9000 normal chondrocytes, colored by the expression of two chondrogenic markers (SOX9 and CD44), the cell surface receptor NOTCH1, and pNF-κB. Expression is set at the max of each channel and is comparable between (E) and (F). (F) tSNE plots of 9000 OA chondrocytes, colored by the expression of two chondrogenic markers (SOX9 and CD44), the cell surface receptor NOTCH1, and pNF-κB. Expression is set at the max of each channel and is comparable between (E) and (F).
