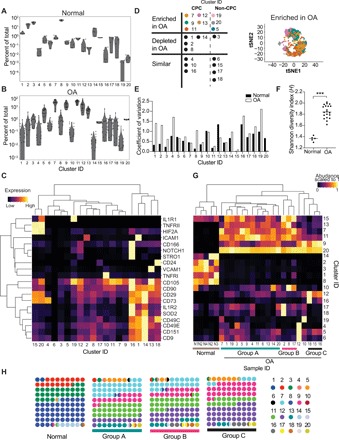
Fig. 2. Normal and OA cartilage landscape consists of both abundant and rare subpopulations.

(A) Abundance of each of the 20 clusters called by FlowSOM analysis in normal samples. Each point represents a single sample. (n = 5). (B) Abundance of each of the 20 clusters called by FlowSOM analysis in OA samples (n = 20). Each point represents a single sample. (C) Expression of cell surface receptors used for delineating the 20 clusters. Expression is averaged between all cells of a given cluster ID. Color is scaled to 1 for each protein between all the clusters. Dendograms were drawn using complete-linkage hierarchical clustering. (D) Table of the cluster IDs that are enriched, depleted, or similar between OA and normal samples. Colors in the enriched section correspond to the tSNE projection on the right. The tSNE projection contains cells from clusters that are enriched in OA compared to normal, sampled to 9000 cells. Enrichment, depletion, or similarity between the ranked means of normal (n = 5) and OA (n = 20) cluster abundance was tested using an unpaired, two-tailed Mann-Whitney test with Bonferroni correction (α = 0.0025). Adjusted P values for all enriched or depleted clusters are 0.002. (E) Coefficient of variation (mean divided by SD) for each cluster in normal or OA samples. (F) Shannon’s diversity index (H) calculated for each normal and OA sample (see Methods). Theoretical max H value is 2.99. Equality between the means H values for OA (n = 20) and normal (n = 5) samples was tested using a two-tailed Mann-Whitney test. ***P = 0.001. (G) Hierarchical clustering of normal and OA samples by cluster abundances. Abundance is scaled to 1. Samples belonging to the three designated groups are labeled at the bottom. (H) Average cluster abundance in normal and group A, B, and C patients with OA. Each color designates a cluster ID.
