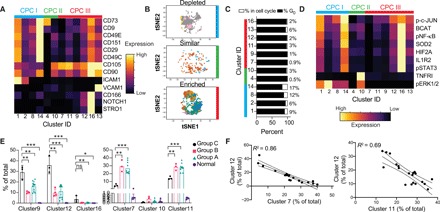
Fig. 3. Patients with OA are differentially enriched in types of CPCs.

(A) Expression of the 13 CPC markers among the clusters that are enriched for them. Expression is scaled to 1 between all clusters. (B) tSNE projections of the type I (depleted), type II (similar), and type III (enriched) CPCs in OA, colored by cluster ID, where each cluster ID has a different color. Cells are sampled to 9000 when possible. (C) Cell cycle analysis for each cluster. Cell cycle stages were analyzed for each cell, and then, the proportion of the population in G0 and in the cell cycle was calculated for each cluster. The percentage in the cell cycle is given to the right of each bar graph. (D) Cell signaling and other intracellular and cell surface receptor markers for the CPC clusters. Expression is scaled to 1. (E) Cluster abundance for each sample in the OA groups and normal cells. Significance is tested with a multiple-test corrected Welch’s t test. ns, not significant. (F) Correlation between abundance of each cluster, labeled on each axis. Each point represents a patient with OA. The full matrix of correlations between clusters is plotted in fig. S3A. *P = 0.05, **P = 0.01, and ***P = 0.001.
