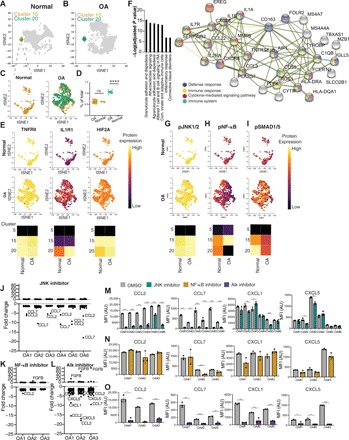
Fig. 4. Identification of a rare immune recruiting population in OA cartilage.

(A) tSNE projection of normal cells (gray) with clusters 15 and 20 colored, sampled at 9000 cells. (B) tSNE projection of OA cells (gray) with clusters 15 and 20 colored, sampled at 9000 cells. (C) A magnified projection of clusters 15 and 20 from normal and OA samples, ****P = 0.0001. (D) Quantification of the abundance of clusters 15 and 20 in normal and OA samples. Significance is tested using Welch’s t test. Each point represents a sample. (E) Magnified projection of clusters 15 and 20 depicting expression of the two cell surface receptors, TNFRII and IL1R1, and of intracellular HIF2A. Expression is scaled to max value in dataset for each protein and is comparable across normal and OA samples. Heatmap below the tSNE depicts quantification of average expression in representative chondrocytes (cluster 5) in comparison to clusters 15 and 20. (F) Single-cell RNA (scRNA) sequencing data from (25) reanalyzed. Cells expressing TNFRII and IL1R1 were sorted in silico, and their transcriptome was compared to the rest of the OA cells and used for Gene Ontology (GO) term and STRING analyses. (G) Same as in (E), for signaling markers pJNK1/2, pNF-κB (H), and pSMAD1/5 (I). (J) Fold change in cytokines from human 62-plex Luminex assay between dimethyl sulfoxide (DMSO) and JNK inhibitor treatment. (K) Fold change in cytokines from human 62-plex Luminex assay between DMSO and NF-κB inhibitor treatment. (L) Fold change in cytokines from human 62-plex Luminex assay between DMSO and Alk inhibitor treatment. (M) Raw mean fluorescence intensity (MFI) values for cytokines that were significantly altered between DMSO- and JNK-treated samples in at least five of six tested OA samples. Significance was first tested for using analysis of variance (ANOVA) with multiple corrections for the 62 comparisons, and then, t test with Tukey’s correction was applied for each comparison on a patient-by-patient sample. Each point represents an independent technical treatment and cytokine analyses for the same patient (n = 6 patients with OA). AU, arbitrary units. (N and O) Same as in (M) but with NF-κB and Alk inhibitors, respectively (n = 3 patients with OA). *P = 0.05, **P = 0.01, and ***P = 0.001.
