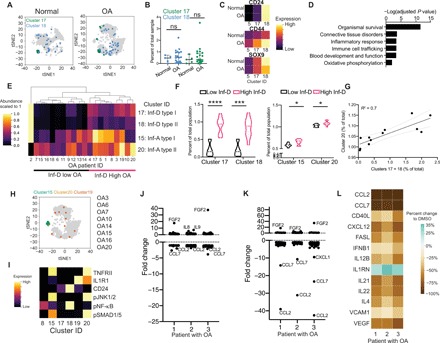
Fig. 5. A CD24+ subpopulation mitigates inflammation in OA cartilage.

(A) tSNE projection of normal and OA cells (gray) with clusters 17 and 18 colored, sampled at 9000 cells each. (B) Abundance of each cluster per sample. Differences between the means were tested using Welch’s t test. (C) Heatmaps of chondrogenic markers SOX9 and CD44, as well as CD24. Expression is scaled to the highest expressing cell in the group. (D) scRNA sequencing data from (25), reanalyzed. Cells expressing CD24 with a high Col2a1/Col1a1 ratio were sorted in silico, and their transcriptome was compared to the rest of the OA cells and used for GO term and STRING analyses. (E) Hierarchical clustering of OA samples based on clusters 15, 17, 18, and 20. Abundance is scaled to one for each cluster. Groups are labeled along the x axis. (F) Violin plots of abundance of clusters 17, 18, 15, and 20 in low and high Inf-D groups. Each sample is represented as a point. (G) Correlation between the abundance of cluster 20 with clusters 17 + 18. Ninety-five percent confidence interval is shown in gray dashed line. Slope of line tested is significantly nonzero. (H) tSNE projection of OA cells, with clusters 15, 20, and 19 labeled, sampled at 9000 cells. (I) Heatmaps of the average expression of each marker in the given cluster. (J) Fold change in cytokines from human 62-plex Luminex assay between control and 3-isobutyl-1-methylxanthine (IBMX) treatment. (K) Fold change in cytokines from human 62-plex Luminex assay between control and a combined IBMX and JNK inhibitor treatment. (L) Percent change in cytokine MFI between control and the combined IBMX/JNK inhibitor treatment.
