Fig. 6. Idler angular distribution.

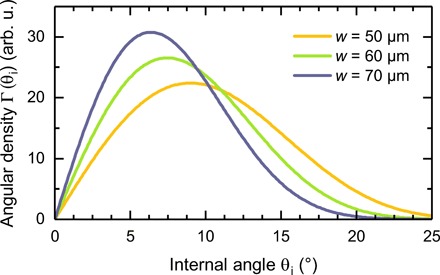
The idler angular density Γ(θi) corresponding to collinear signal angles is plotted as a function of the idler angle inside the PPLN crystal θi for three different pump radii.

The idler angular density Γ(θi) corresponding to collinear signal angles is plotted as a function of the idler angle inside the PPLN crystal θi for three different pump radii.