. 2020 Mar 2;9:e54841. doi: 10.7554/eLife.54841

Figure 3. Hepatic immunoblot analysis and body weights of Ubiad1-deficient mice on HmgcrWT/WT and HmgcrKi/Ki backgrounds.

(A and B) Male and female WT and Ubiad1+/- (A) or Ubiad1+/+: :HmgcrKi/Ki, Ubiad1+/-: :HmgcrKi/Ki, and Ubiad1-/-: :HmgcrKi/Ki (B) littermates (8 weeks of age, five mice/group) were fed an ad libitum chow diet prior to weighing and sacrifice. Livers were harvested and subjected to subcellular fractionation as described in ‘Materials and methods.’ Aliquots of resulting membrane (Memb.) and nuclear extract (N.E.) fractions (80–160 µg protein/lane) for each group were pooled and subjected to SDS-PAGE, followed by immunoblot analysis using antibodies against endogenous HMGCR, UBIAD1, SREBP-1, SREBP-2, calnexin, and LSD-1. Although shown in separate panels, LSD-1 is a loading control for nuclear SREBP immunoblots. (C) Male and female Ubiad1+/+: :HmgcrKi/Ki, Ubiad1+/-: :HmgcrKi/Ki, and Ubiad1-/-: :HmgcrKi/Ki littermates (eight mice/group) were weaned at 4 weeks of age, fed chow diet ad libitum, and weighed for seven consecutive weeks, after which they were sacrificed. Error bars, S.E. *, p<0.05 and ****, p<0.0001.

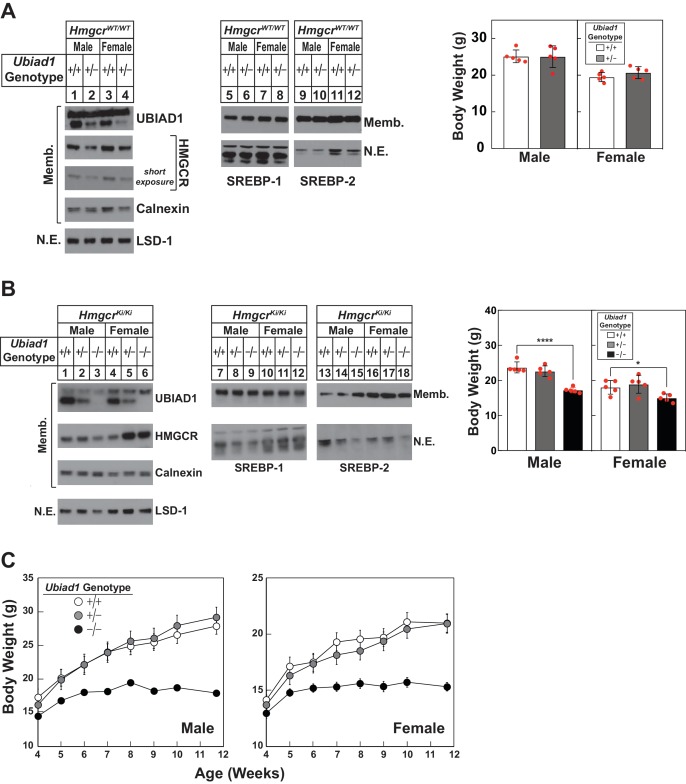
Figure 3—source data 1. Body weights of Ubiad1-/-: : HmgcrKi/Ki mice.

Figure 3.

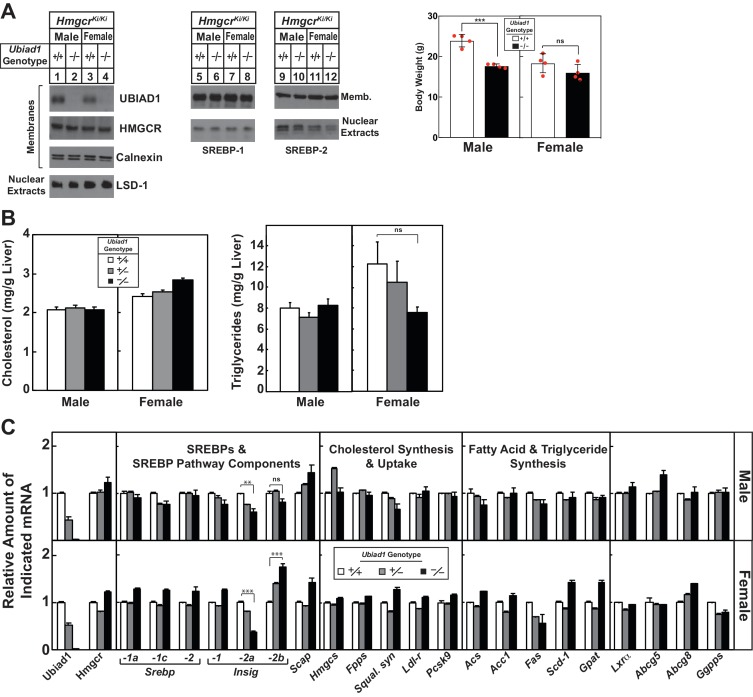
Figure 3—figure supplement 1. Characterization of Ubiad1-deficient mice.

Figure 3—figure supplement 1.

(A) Male and female Ubiad1+/+: :HmgcrKi/Ki and Ubiad1-/-: :HmgcrKi/Ki littermates (Disrupted Allele B) (8 weeks of age, eight mice/group) were fed an ad libitum chow diet prior to weighing and sacrifice. Livers of the mice were harvested and subjected to subcellular fractionation and immunoblot analysis as described in the legend to Figure 3A and B). (B and C) Ubiad1+/+: :HmgcrKi/Ki, Ubiad1+/-: :HmgcrKi/Ki, and Ubiad1-/-: :HmgcrKi/Ki littermates (Disrupted Allele A) were fed an ad libitum chow diet prior to weighing and sacrifice. Livers of the mice were harvested for measurement of cholesterol and triglyceride levels (B) and quantitative real-time PCR analysis using primers against the indicated mRNA and apoB mRNA as an invariant control (C). Each value represents the amount of mRNA relative to that in Ubiad1+/+: :HmgcrKi/Ki mice, which was arbitrarily set as 1. Each bar represents the mean ± S.E. of data from eight mice. **, p<0.01; ***, p<0.001.
Figure 3—figure supplement 1—source data 1. Body weights and hepatic lipid levels of Ubiad1-/-: : HmgcrKi/Ki mice.