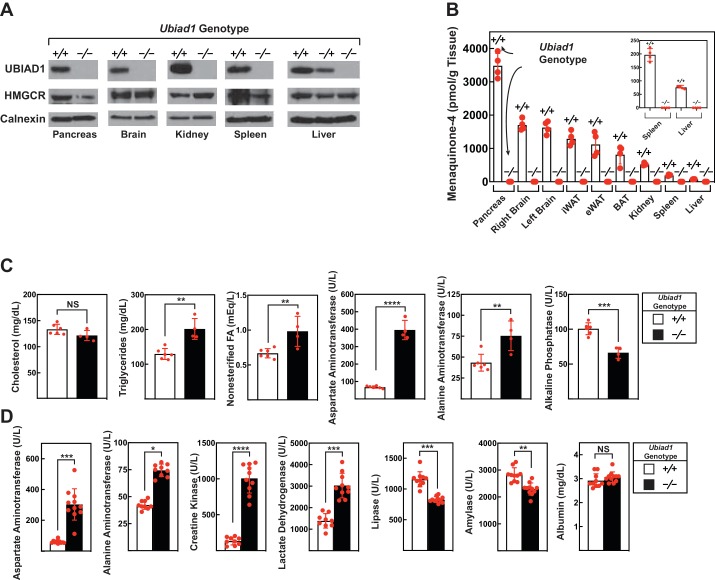
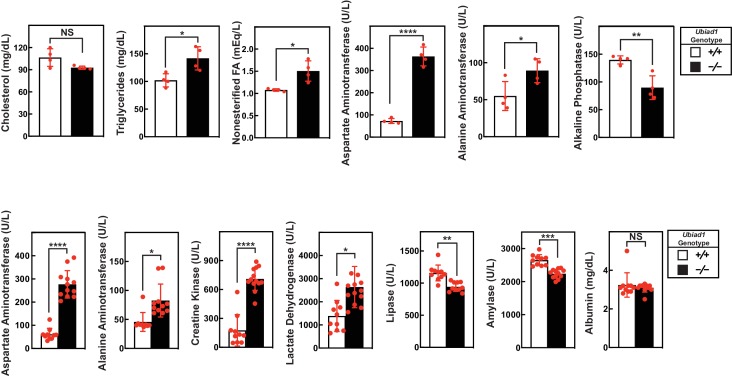
Figure 4. Levels of HMGCR, UBIAD1, and MK-4 in various tissues and blood chemistry analysis of Ubiad1-deficient mice.
Male Ubiad1+/+: :HmgcrKi/Ki and Ubiad1-/-: :HmgcrKi/Ki littermates (12 weeks of age, 4–11 mice/group) were fed an ad libitum chow diet prior to sacrifice. (A and B) Indicated tissues were harvested for subcellular fractionation, after which aliquots of membrane fractions were subjected to immunoblot analysis using antibodies against HMGCR, UBIAD1, and calnexin (A). Some of the tissues were subjected to homogenization (B) for subsequent determination of MK-4 levels by reverse-phase high performance liquid chromatography or liquid chromatography-mass spectrometry as described in ‘Materials and methods.’ (C and D) Blood drawn from mice following sacrifice was subjected to chemical analysis by the Metabolic Phenotyping Core Facility in the Touchstone Diabetes Center (UT Southwestern Medical Center). Bars, mean ± S.E. of data from 4 to 11 mice. *, p<0.05; **, p<0.01; ***, p<0.001; ****, p<0.0001.


