. 2020 Mar 2;9:e54841. doi: 10.7554/eLife.54841

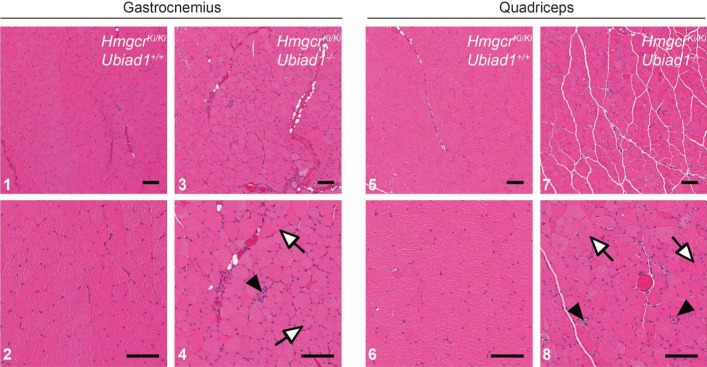
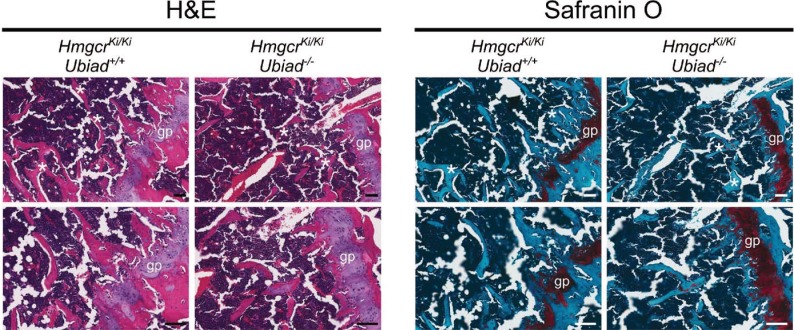
Figure 5. Histological analysis of skeletal muscle and femoral growth plates from Ubiad1+/+: :HmgcrKi/Ki and Ubiad1-/-: :HmgcrKi/Ki mice.

Histological analysis of gastrocnemius and quadriceps muscles (A) and femoral growth plates (B) from male Ubiad1+/+: :HmgcrKi/Ki and Ubiad1-/-: :HmgcrKi/Ki littermates using H and E and Safranin O staining. Myofibers harboring centrally-localized nuclei are indicated by white arrows, and degenerating myofibers with macrophage infiltration are indicted by black arrowheads in (A). Asterisks in (B) indicate boney trabeculae, and red hue in Safranin O-stained sections highlight cartilage. gp, growth plate. Scale bars, 100 µm.

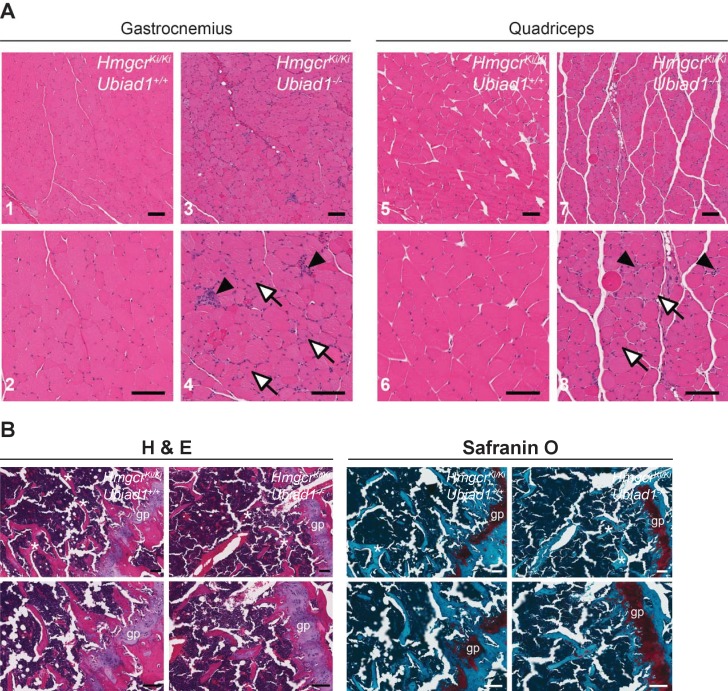
Figure 5.

Figure 5—figure supplement 1. Histological analysis of gastrocnemius and quadriceps muscles from female Ubiad1+/+: :HmgcrKi/Ki and Ubiad1-/-: :HmgcrKi/Ki littermates using H and E staining.

Figure 5—figure supplement 1.

Myofibers harboring centrally-localized nuclei are indicated by white arrows and infiltrating macrophages are indicted by black arrowheads. Scale bars = 100 µm.

Figure 5—figure supplement 2. Histological analysis of femoral growth plates from female Ubiad1+/+: :HmgcrKi/Ki and Ubiad1-/-: :HmgcrKi/Ki littermates using H and E and Safranin O staining.

Figure 5—figure supplement 2.

Asterisks denote boney trabeculae, and the red hue in the Safranin O-stained sections highlight cartilage. gp, growth plate. Scale bars = 100 µm.