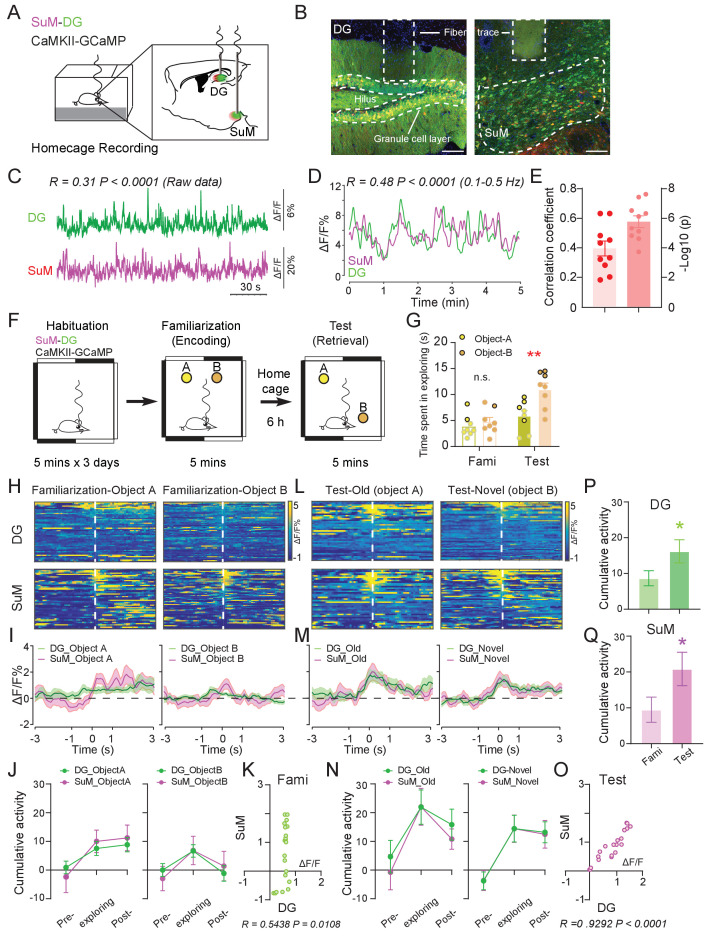
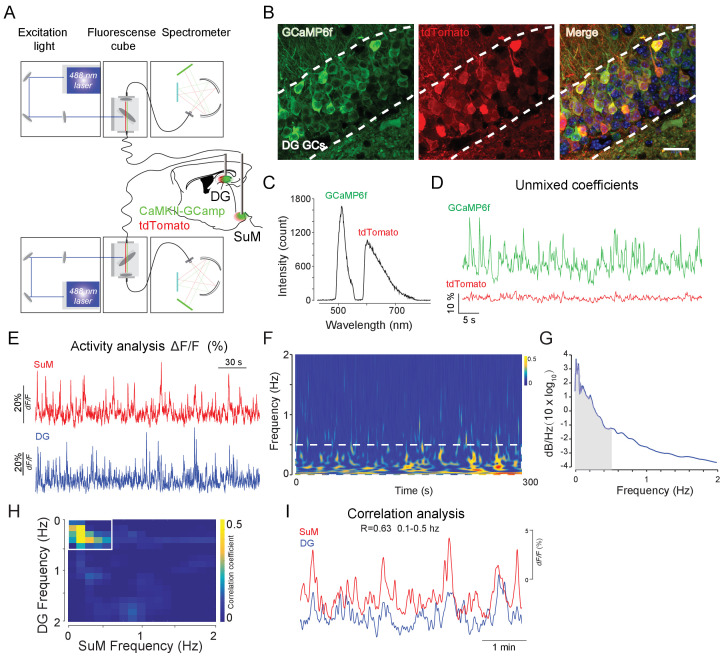
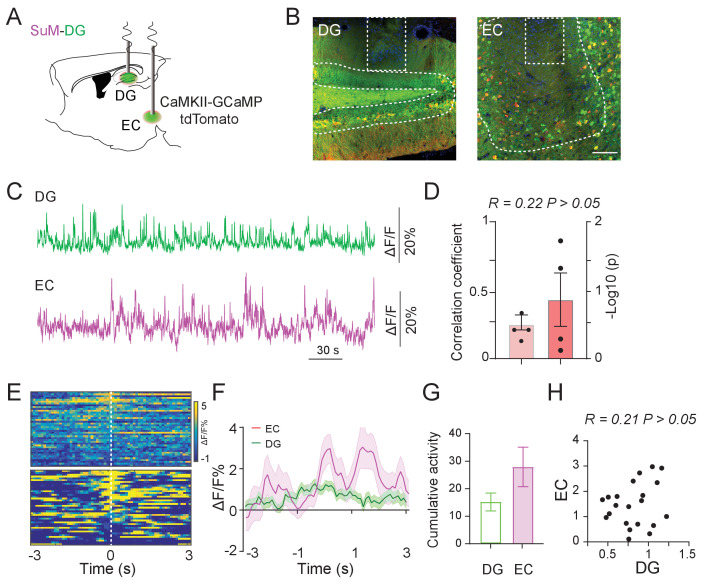
Figure 1. Ca2+ activities of the SuM and DG at home cage and during the spatial memory test.
(A) Experimental diagram of the DG and SuM calcium recording at the home cage. (B) Coronal sections showing photometry fiber traces and CaMKII-GCaMP/tdTomato expressed neurons in the DG (left) and SuM (right). Scale bar = 100 µm. (C) A sample of normalized ΔF/F of GCaMP6f signals from the DG and SuM. The traces of GCaMP activity were moderately correlated with R = 0.31, p < 0.0001 at home cage. (D) Sample of GCaMP6f traces of the DG and SuM in 0.1–0.5 Hz spectrum. The traces of GCaMP signals were moderately correlated with R = 0.48, p < 0.0001. (E) Mean correlation of SuM and DG calcium activity in 0.1–0.5 Hz spectrum. n = 10 mice, R = 0.40, p<0.0001. (F) Experimental illustration of in vivo fiber photometry recordings during the NPR test. After 3 days of habituation, mice were recorded for calcium activity during distinct phases (spatial memory encoding versus retrieval) of the NPR test. (G) Time spent exploring the objects during the NPR test. In the test phase, time spent exploring the novel-location object (B) was significantly increased (n = 8 mice, paired t-test, t1,7 = 6.843, **p < 0.01). No difference was found during familiarization (n = 8 mice, paired t-test, t1,7 = 1.593, p = 0.16). (H, L) Scaled color plot of DG and SuM calcium activity while exploring object A (old location) and object B (novel location) during familiarization (H) and test (L) phase, respectively. n = 49, 62, 39, 59 trails. (I, M) Averaged DG and SuM calcium activities during familiarization (I) and test (M). Semi-transparent borders indicate ± SEM. (J, N) Cumulative DG and SuM calcium activities in the NPR test. Time points when mice started to explore the objects were defined as 0 s. Calcium activity was aligned within a 2 s time window at each phase: pre-exploring (−3 ~ −1 s), exploring (−1 ~ 1 s) and post-exploring (1 ~ 3 s). Cumulative activity = ∆F/F × Time (2 s). Calcium activity in both the DG and SuM increased when mice were exploring objects/locations during familiarization (J) and test (N). (K, O) Correlation of the SuM and DG calcium activity during familiarization (K) and test (O). Calcium activity of the SuM and DG during exploration was highly correlated (R = 0.9292, p < 0.0001) during spatial memory retrieval, as compared to a moderate correlation (R = 0.5438, p<0.0108) during spatial memory encoding. (P, Q) Cumulative activity of the DG (P) and SuM (Q) was increased during test, compared to familiarization. DG: Unpaired t-test, t207 = 2.009, *p=0.0459. SuM: Unpaired t-test, t207 = 1.975, *p = 0.0496.


