. 2020 Mar 13;9:e53129. doi: 10.7554/eLife.53129

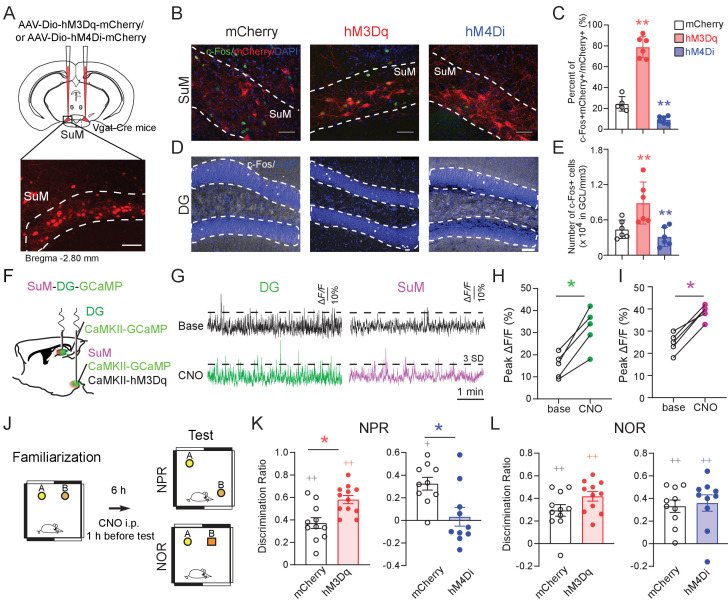
Figure 2. SuM activity is required for spatial memory retrieval.

(A) Experimental scheme. Coronal sections showing mCherry expression in SuMLVgat neurons in Vgat-Cre mice. Scale bar = 100 µm. (B) Sample images showing the c-Fos expression in SuMLVgat neurons 1 hr after CNO injection from AAV-DIO-hM3Dq- and AAV-DIO-hM4Di- injected mice. Scale bar = 100 µm. (C) Quantification of the density of c-Fos+/mCherry+ SuM neurons. CNO 1 mg/kg induced higher density of c-Fos+/hM3Dq-mCherry+ cells, but lower density of c-Fos+/hM4Di-mCherry+ cells. (n = 5–6 mice, one-way ANOVA followed by PLSD post hoc test, **p < 0.01). (D) Sample images showing c-Fos expression in the DG 1 hr after CNO injection from AAV-DIO-hM3Dq- and AAV-DIO-hM4Di- injected mice. Scale bar = 100 µm. (E) Quantification of c-Fos expression in DG GCs. C-Fos+ GCs were increased in hM3Dq-mice, but decreased in hM4Di-mice 1 hr after CNO injection. GCL: granule cell layer. (n = 5–6 mice, one-way ANOVA followed by PLSD post hoc test, **p < 0.01). (F) Diagram of in vivo photometry recording. AAV-CaMKII-GCaMP6f was injected in the left DG, and AAV-CaMKII-GCaMP6f mixed with CaMKII-hM3Dq was injected in the left SuM. Optic fibers were implanted above the DG and SuM, respectively. (G) Typical GCaMP6f traces (5 min) of baseline (upper) and 40 mins after 1 mg/kg CNO injection (below) from the DG and SuM. (H) The peak ∆F/F of the DG calcium signal increased after CNO injection. (n = 5 mice, paired t-test, t = 6.126, *p < 0.05). (I) The peak of ∆F/F of the SuM calcium signal increased after CNO injection. (n = 5 mice, paired t-test, t = 9.037, *p < 0.05). (J) Diagram of the NPR and NOR tests. CNO (1 mg/kg) was administrated 1 hr before these tests. (K) Activation or inhibition of SuMVgat neurons increased or decreased the discrimination ratio in the NPR test, respectively. (Unpaired t-test, t21 = 2.244, *p = 0.0358 in hM3Dq-mice, t18 = 2.238, *p = 0.0381 in hM4Di-mice). (L) Activation or inhibition of SuMVgat neurons did not change the discrimination ratio in the NOR test. (Unpaired t-test, t21 = 1.869, p > 0.05 in hM3Dq-mice, t18 = 0.9197, p > 0.05 in hM4Di-mice).

Figure 2.

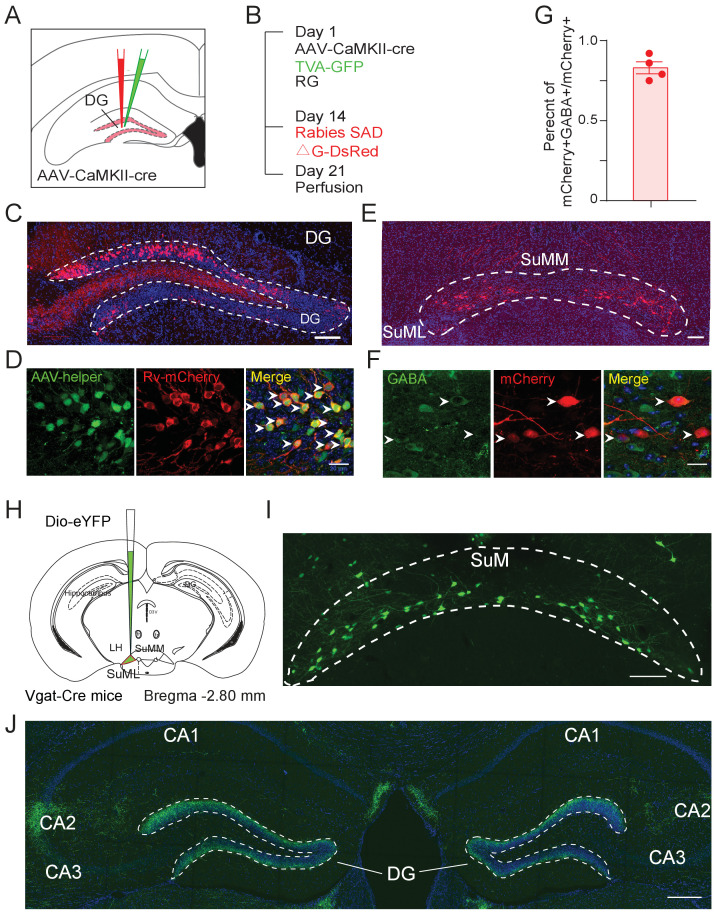
Figure 2—figure supplement 1. Cell-type-specific anterograde and retrograde tracing for SuMVgat-DG connections.

Figure 2—figure supplement 1.

(A) Diagram of rabies-based monosynaptic synaptic tracing of DG GCs. (B) Experimental timeline of retrograde tracing. On day 1, AAV-CaMKII-Cre, Cre-dependent TVA-GFP and RG virus were injected to the left DG. On day 14, Rabies-mCherry was injected at the same site and mice were perfused on day 21. (C) Fluorescence images showing starter cells with mCherry expressions in the DG. Scale bar = 100 µm. (D) Amplified starter cells in the DG. Zoomed-in view of injection site showing that starter neurons (yellow, arrows indicated) were infected with AAV helper virus (green) and RV (red). Scale bar = 20 µm. (E) Representative coronal section showing retrogradely RV-labeled cell bodies (red) were in the SuM, with dense mCherry+ cells in the lateral SuM (SuML) and sparse mCherry+ cells in the medial SuM (SuMM). Scale bar = 100 µm. (F) RV-labeled SuML neurons were positive for GABA staining (white arrows indicated). Scale bar = 20 µm. (G) Percentage of retrograde labeling mCherry+ cells co-localized with GABA staining in the SuML. (H) Diagram of anterograde tracing. AAV5-DIO-eYFP was delivered to the SuML in Vgat-Cre mice. (I–J) Fluorescence images showed SuML projections located in the DG and CA2. Scale bar = 200 µm.
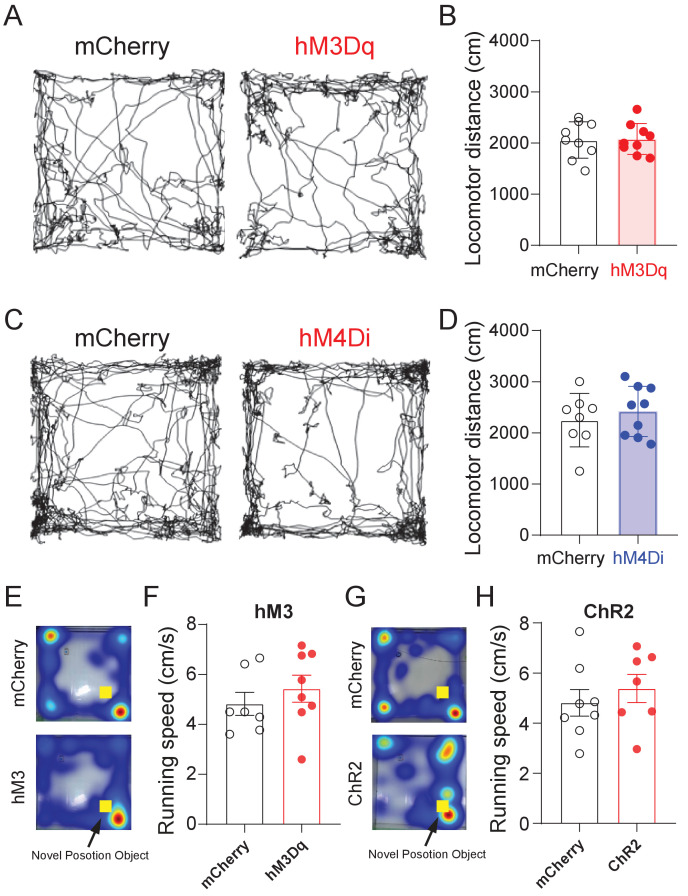
Figure 2—figure supplement 2. Locomotor activity after activity manipulation of SuMVgat neurons.

Figure 2—figure supplement 2.

Locomotor activity in the open field (5 mins, same for both NPR and NOR tests) was recorded 1 hr after CNO administration in mice injected with AAVs expressing mCherry-, hM3Dq- or hM4Di. (A-B) Typical locomotor traces (A) of mCherry- or hM3Dq- mice after CNO injection, and locomotor activity was not changed (B), compared to mCherry control mice (unpaired t-test, t16 = 0.1325, p=0.8963). (C-D) Typical locomotor traces (C) of mCherry- or hM4Di- mice after CNO injection, showed locomotor activity was not changed (D), compared to mCherry control mice (unpaired t-test, t16 = 0.2374, p = 0.8177). (E, G) Heatmap of representative locomotor traces in the NPR test during chemogenetic activation of SuM neurons (E) or optogenetic activation of SuM-DG projections (G), respectively. (F, H) The average running speed during the NPR test during chemogenetic activation of SuM neurons (F) or optogenetic activation of SuM-DG projections (H), respectively. p > 0.05 by unpaired t-test.
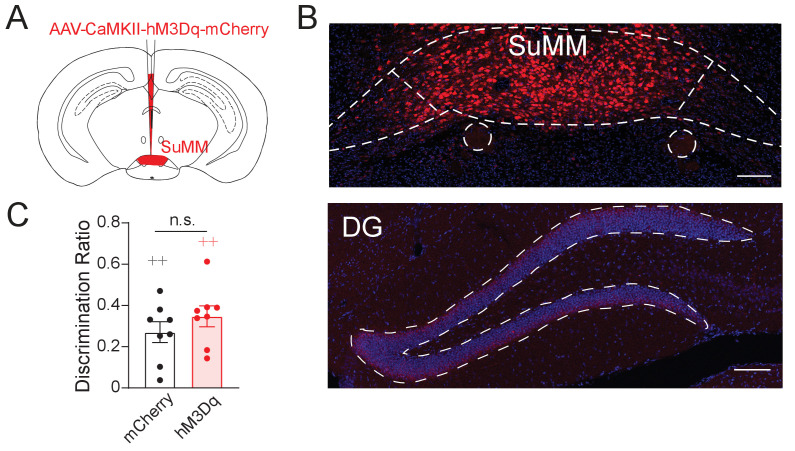
Figure 2—figure supplement 3. Stimulation of SuMM neurons did not significantly increase spatial memory.

Figure 2—figure supplement 3.

(A) Schematic diagram of the viral delivery. AAV5-CaMKII-mCherry (150 nL) was injected to the SuMM. (B) The representative image showing mCherry expression preferentially in the SuMM. (C) Chemogenetic activation of SuMM neurons did not significantly alter the discrimination ratio in the NPR test.