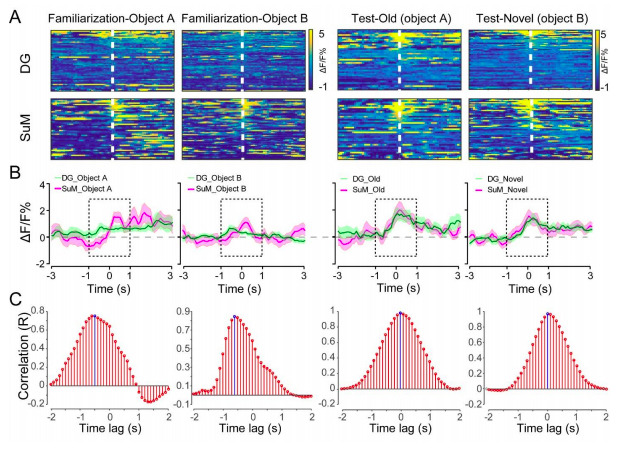
Author response image 1. The time lag between the SuM and DG calcium activities.

(A) Scaled color plot of the SuM and DG calcium activity. (B) Averaged DG and SuM calcium activities. (C) Cross correlation of the DG and SuM calcium activities during the exploring phase (2 s). The highest correlation appeared at -0.5 and -0.6 s during familiarization, indicating that there is a 0.5-0.6 s time lag between the DG and SuM calcium activities in memory encoding. In contrast, during spatial memory retrieval, the highest correlation appeared at 0 s, indicating no time lag between the DG and SuM calcium activities in memory retrieval.
