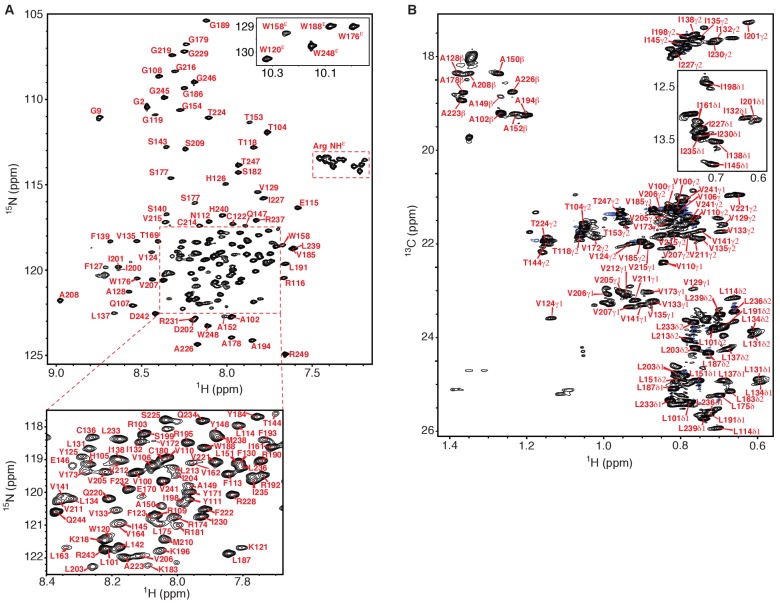
Figure 1. NMR spectra of the human KCNQ1 voltage-sensor domain.
(A) 1H-15N TROSY-HSQC spectrum recorded at 900 MHz of 2H,13C,15N-Q1-VSD in LMPG micelles. Backbone amide peaks for 140 out of 147 non-proline residues (95%) have been assigned. Only a single set of peaks is observed. (B) 1H-13C HSQC methyl optimized spectrum recorded at 900 MHz of 13C,15N-Q1-VSD in perdeuterated LMPG micelles. Methyl groups for 58 out of 68 (85%) residues were assigned (Ala 10 of10, Thr 6 of 8, Ile 9 of 11, Val 18 of 22, Leu 15 of 17). In addition to the presence of a very limited number of unassigned peaks from the VSD in this spectrum other unassigned peaks likely derive from natural abundance 13C in residually protonated LMPG and also from the fully protonated buffer components TCEP and MES. The chemical shift assignments illustrated for panels A and B shift have been deposited in BioMagResBank (BMRB ID 30517).
Figure 1—figure supplement 1. Long range PREs are consistent with the expected KCNQ1 VSD topology in LMPG micelles.

Figure 1—figure supplement 2. TALOS-N secondary structure analysis of backbone chemical shifts (top panel) and (bottom panels) deviations of the (Osteen et al., 2012) Cα and carbonyl 13C’ chemical shifts from random coil values.
Figure 1—figure supplement 3. Examples of NOE measurements.


