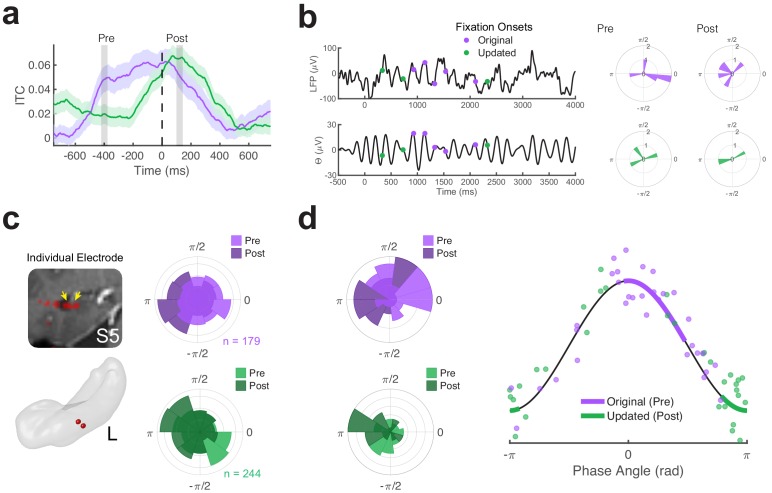
Figure 3. Distinct phases of theta phase are associated with retrieval and associative novelty.
(a) Timecourse of inter-trial coherence (ITC) for theta (5 Hz) phase during Mismatch trials. Pre- and post-fixation time-periods of interest are indicated by vertical bars. Shaded regions depict ± SEM. (b) Theta phase distributions for an example Mismatch trial. Left, the local field potential measured across an electrode (low-pass filtered at 20 Hz for display) is plotted above the prominent theta (4 to 6 Hz bandpass filtered) timeseries. Time zero denotes the start of the trial. Right, polar histograms show the corresponding distributions of phase angles in the Pre and Post fixation periods for fixations to the original (top panels) and updated (bottom panels) object-locations. (c) Theta phase distributions for a left (L) hippocampal electrode from subject 5 (S5) . Histograms show phase distributions during each time period of interest, aggregated across all fixations of interest during Mismatch trials. (d) Differences in theta phase distributions across all electrodes. Left, polar histograms show the distribution of theta phases across electrodes, averaged for each fixation target. Right, retrieval and novelty-related clustering are associated with distinct phases of theta. Dots depict the average phase angle for each electrode, with 95% confidence intervals indicated by heavy lines.

