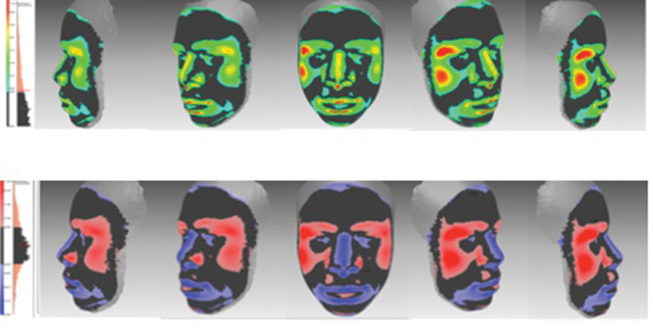
Fig. 6.

Absolute and color histogram of Zim-M versus AA-M. The average distance of the differences was 0.51 ± 0±.41 mm. The absolute difference ranged from 0 to 4.47 mm. Positive differences are seen in red and negative differences in blue. The average difference was 0.02 ± 0.66 mm and 58.75% of the faces were similar. AA-M, African American males; Zim-M, Zimbabwean males.
