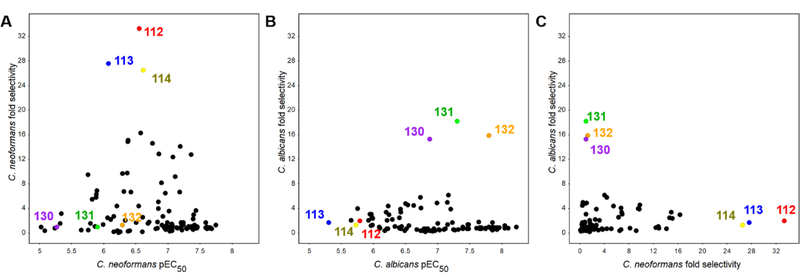
Figure 3.
Scatter plots depict fungal potency (x-axis) vs. fungal selectivity (y-axis) relationships for all aminopyrazoles when screened using human cell lysate and lysate of either C. neoformans (Panel A) or C. albicans (Panel B). All potencies are reported as the inverse log10 of compound EC50 (pEC50 as measured by FP assay). The scatter plot in Panel C compares compound selectivity patterns between the two fungi. Key fungal-selective compounds for each species (112–114 and 130–132) are highlighted in color to underscore their divergence in potency and selectivity. Each point represents the mean of duplicate determinations in a single experiment.

