Table 4.
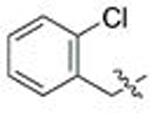
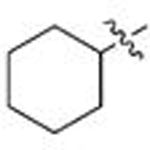
Examining varied parings of R1/R2 substitutions on the aminopyrazole ring. Fold selectivity >5 for any compound is highlighted in red.
 | ||||||||
|---|---|---|---|---|---|---|---|---|
| Entry | Compound | X | R1 | R2 |
C. neoformans EC50a (μM) |
C. neoformans fold- selectivityb |
C. albicans EC50c (μM) |
C. albicans fold- selectivityb |
| 1 | 88 | A |  |
CH3 | 0.252 | 0.2 | 0.121 | 0.3 |
| 2 | 89 | A |  |
CH3 | 0.560 | 0.2 | 0.116 | 0.4 |
| 3 | 90 | A |  |
CH3 | 0.700 | 0.2 | 0.134 | 0.4 |
| 4 | 91 | A | CH3 | Ph | 0.078 | 9.2 | 0.328 | 0.4 |
| 5 | 92 | B | 0.127 | 8.2 | 0.395 | 0.8 | ||
| 6 | 93 | C | 0.066 | 6.7 | 0.213 | 0.6 | ||
| 7 | 94 | B | tBu | Ph | 0.517 | 9.7 | 0.379 | 3.9 |
| 8 | 95 | C | 0.379 | 6.7 | 0.182 | 4.1 | ||
| 9 | 96 | B |  |
Ph | 0.615 | 0.4 | 0.059 | 1.7 |
| 10 | 97 | C | 0.419 | 0.3 | 0.034 | 1.4 | ||
| 11 | 98 | B | iBu | Ph | 0.315 | 1.7 | 0.100 | 1.6 |
| 12 | 99 | C | 0.147 | 1.8 | 0.070 | 1.4 | ||
EC50 and selectivity values were determined as described for Table 1.
