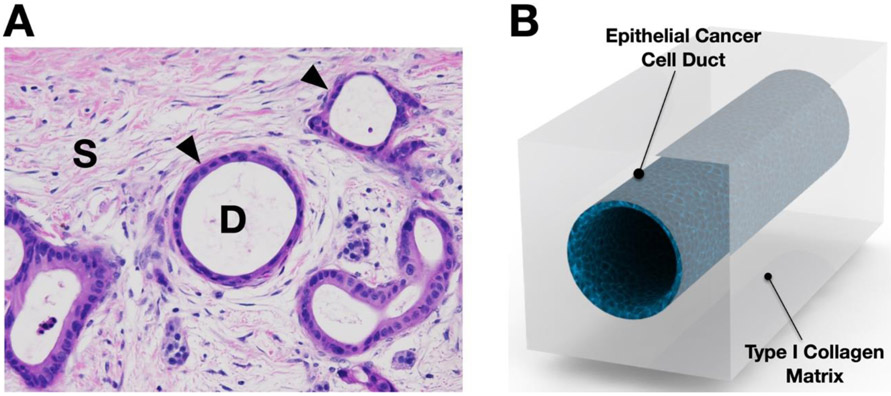
Figure 1.
Design of ductal T-MOC platform. (A) The murine PDAC micrograph shows a cross section H&E staining of PCC ducts (noted with arrowheads and "D") and stroma tissue (noted with "S"). (B) The dT-MOC model is designed to mimic the microanatomy of PDAC tumors where PCC ducts are surrounded by stromal matrix.

