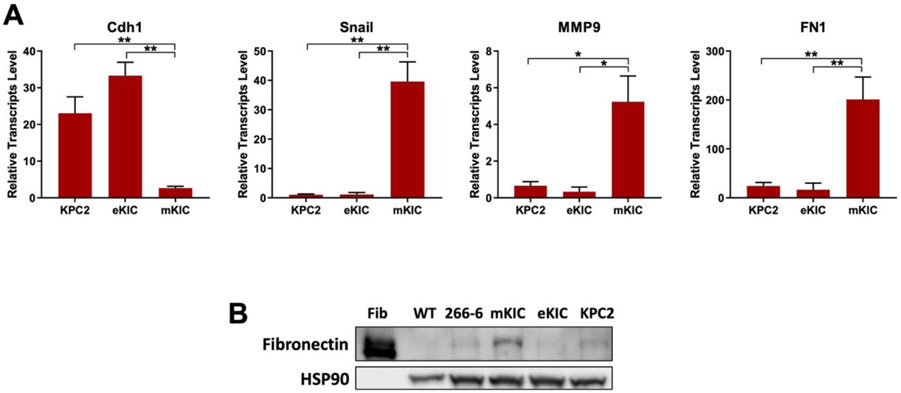
Figure 3.
Molecular analysis of cells used in dT-MOC platform. (A) RT-qPCR results. Transcript levels of E-cadherin (Cdh1) (epithelial marker), and Snail and MMP9 (EMT and mesenchymal markers) show heterogeneous expression of these genes in the cancer cell lines studied. (*, p < 0.05 and **, p < 0.01). (B) Immnoblot analysis. Fibronectin (FN1) levels are confirmed in mKIC cells. The WT pancreas, acinar cell line (266-6), eKIC and KPC2 samples have neglectable levels of Fibronectin whereas mKIC exhibit high levels of Fibronectin protein. Note that pure Fibronectin protein (Fib) was used as a positive control.

