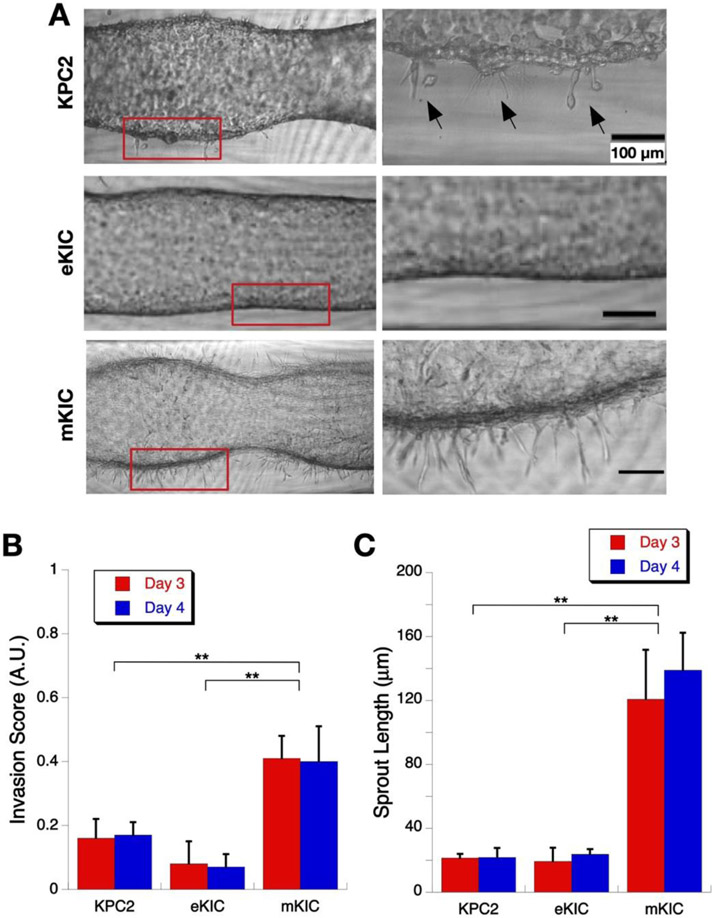
Figure 4.
Local Invasion of cancer cells in the dT-MOC platforms. (A) Micrographs of growth and invasion of KPC2, eKIC, and mKIC cells. Zoomed-in images of boxed areas are shown at the right side. (B) Invasion score at Days 3 and 4. The mKIC line shows higher invasion score than other cell lines (**, p < 0.01). (C) Mean sprout length at Days 3 and 4. Again, the mKIC line shows longer sprouts than other cell lines (**, p < 0.01)

